

A fasting blood glucose (FBG) reading between 70-100 mg/dL is typically regarded as normal in people without diabetes1. While this range serves as a standard reference for assessing one’s glycemic status, inter-individual differences exist across the population. A better understanding of one’s own FBG range might provide a more actionable basis for reference.
Mobile health (mHealth) technologies such as diabetes management apps allow one to track his/her own blood glucose data. Access to this data gives the user a more detailed understanding of their own FBG profile and range. This can be leveraged to help users make more appropriate lifestyle and behavior choices in diabetes management.
To demonstrate how mHealth diabetes management tools like the Glooko mobile app can help me understand my glycemic status better, I self-monitored my blood glucose (SMBG) levels over the last month or so. I then queried my own user data from the Glooko secure database to see if I can learn something interesting about my own FBG levels.
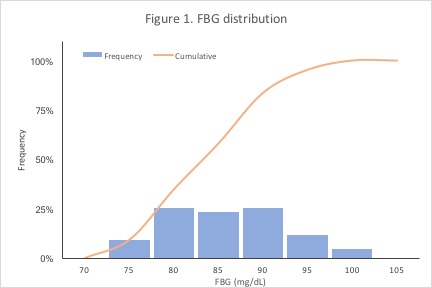
First, I was interested in how my FBG distribution looked. Figure 1 shows the relative and cumulative frequencies of my FBG readings, binned from 70-105 mg/dL. My FBG readings centered around 80-85 mg/dL (median = 82 mg/dL), and 75% of my FBG readings were 89.5 mg/dL or lower. My FBG readings were well within the reference range of 70-100 mg/dL – an expected finding for someone without diabetes.
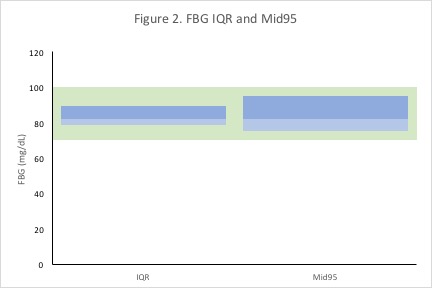
Next, I was interested in knowing a little bit more about the dispersion (or spread) of my FBG readings. In particular, I was curious about my middle 50% (interquartile range; IQR) and middle 95% FBG ranges. The IQR and middle 95% ranges are indicators of the central majority of my FBG readings. Figure 2 shows that my IQR was 78.5-89.5 mg/dL and my middle 95% was 75-95 mg/dL. Collectively, these findings indicate that the central majority of my FBG levels occupy a slightly narrower range than the 70-100mg/dL reference.
In having this more nuanced understanding of my typical FBG range, I can customize my Glooko app dashboard to reflect these ranges instead of the default/standard range. Knowing my individual FBG range helps me interpret my FBG data in a more meaningful way.
Because inter-individual differences exist in the population, being able to leverage one’s own data can be important for informing more appropriate behavior and more targeted treatment. After all, what’s considered a typical/healthy FBG range for one individual might not necessarily be considered typical/healthy for another. To gain an appreciation of the extent of individual differences in FBG, I queried the Glooko user base for data from Glooko users who were within 10 years of my age and self-identified as having prediabetes to qualitatively compare my FBG range.
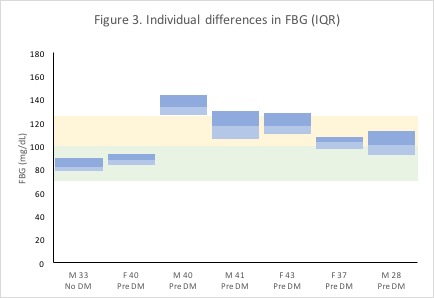
Among six randomly-selected users that fit the query criteria, we can see appreciable differences in users’ average FBG levels and the extent of variation in users’ FBG readings (Figure 3). Median FBGs ranged from 88 mg/dL to 133 mg/dL (user 1: 40 yo female; user 2: 40 yo male), and the IQR widths ranged from 9 mg/dL to 24 mg/dL (user 1: 40 yo female; user 3: 43 yo female). For a visual comparison, my FBG IQR from Figure 2 is shown in the first column in Figure 3, juxtaposed to other users’ FBG IQRs in the subsequent columns. Given this much variation across individuals, using individualized FBG reference ranges might be more helpful for more precise diabetes management.
In the figures above, I leveraged real FBG data to show how mHealth tools can help improve someone’s lifestyle and behavior choices in diabetes management. Taken together, these findings demonstrate the extent to which individuals can differ in their FBG ranges and describe the importance of tracking an individual’s own SMBG/FBG data to generate actionable insights. For people with diabetes, this might enable better management practices. For those who have prediabetes, this might mean preventing or delaying the onset of diabetes. Going forward, I am excited that innovative mHealth diabetes management platforms such as Glooko can help people track their blood glucose data more easily and manage their diabetes better.
1 “Diabetes Tests and Diagnosis.” Mayo Clinic. Mayo Foundation for Medical Education and Research, 31 July 2014. Web. 21 June 2017.
This blog is not intended to be a substitute for professional medical advice, diagnosis, or treatment. Always seek the advice of your healthcare provider with any questions you may have regarding your medical condition.
