
 Mondial
  Allemagne
  Espagne
  France
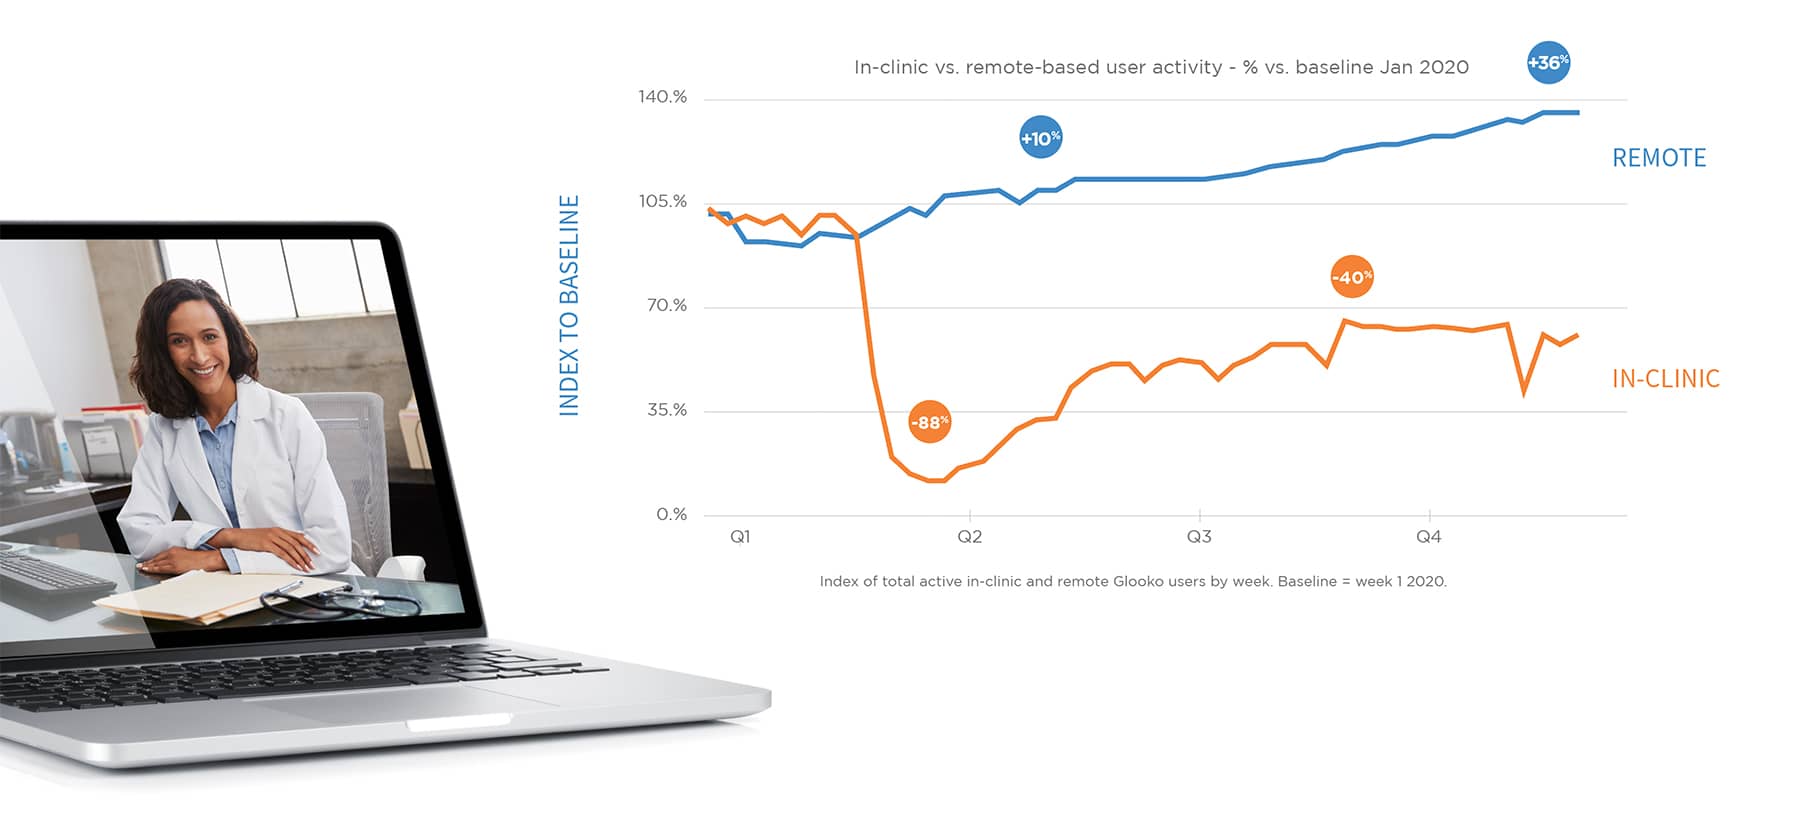
Glooko is the leading diabetes data management and remote patient monitoring platform used by millions of people with diabetes and thousands of clinics worldwide. Our system has generated billions of real-world data points since 2005, enabling providers to analyze data from over 200 diabetes and biometric devices in a single location to improve patient care. This annual report shares some of the key findings from the global data collected in 2020 during the pandemic.
Summary
- During 2020, we captured millions of data points bringing our repository of real world data to 32+ billion data points
- When clinics shut down because of the COVID-19 outbreak, uploads from home increased by 36% and remained high even as clinics reopened
- Glooko users reported lower daily glucose levels immediately after the outbreak and also 5 months later
- Globally, Glooko users’ glucose readings were within recommended range over 50% of the time. When user testing increased, blood glucose levels decreased
- Remote care provides clinics and patients with insights to collaborate and manage diabetes despite lack of in-clinic visits. Increased self monitoring of blood glucose (SMBG) was associated with decreased mean glucose levels

The expansion in reimbursement coverage for both telehealth and remote patient monitoring (RPM) services offers unique opportunities for delivering enhanced care for patients with diabetes, and many healthcare organizations are seeking to take advantage.
For those organizations that are either starting or scaling virtual patient care programs, a common and recurring step in the workflow is identifying which patients are “at-risk” and could benefit from more care. By doing so, health systems are able to deliver targeted and proactive care to those patients, which can result in improved long term patient outcomes and cost-savings. Prior to the expansions in reimbursement coverage, delivering proactive, virtual care was a service few health systems could afford because of the strict constraints on what kinds of virtual appointments were reimbursable.
Three common challenges in identifying at-risk patients
The process of “identifying at-risk” patients must be implemented through a collaboration between an organization’s clinical & IT teams, that together define what it means for a patient to be “at-risk” using data stored in the EHR. While this workflow is understood in theory, three common challenges associated with operationalizing this workflow are equally understood:
- the EHR data used for risk-triaging is often inconsistent or incomplete (Botsis et al., 2010)
- defining what it means to be “at-risk” varies by demographic and there can be many “risk cohorts”
- there is often insufficient IT/analyst capacity to address the data-intensive work posed by challenges 1 & 2.
These opportunities and challenges are amplified within diabetes care. “Beyond A1c” glucose & insulin metrics derived from diabetes self-management devices can be used to risk stratify diabetes populations with accuracy and latency not achievable when leveraging standard diabetes-related EHR data (e.g. A1c values, singular fasting glucose values). But because “diabetes device” data interoperability has only recently become portable, most healthcare organizations are not yet equipped to store diabetes device data with high granularity within their EHR and thus currently can’t use these data.
Glooko’s solution
To assist our users, Glooko has developed a comprehensive digital health platform for diabetes that includes the “at-risk” feature which allows healthcare organizations to risk-triage their diabetes population.
Using Risk-Triaging & Cohorting to Support RPM & Telehealth
1. Prevent Emergency Room visits by identifying patients experiencing hypoglycemia
Hypoglycemia can be dangerous for people with diabetes and hypoglycemia-related ER hospitalizations are expensive for healthcare organizations (Bronstone & Graham, 2016). Hypoglycemia is especially prevalent within Type 1 diabetes adolescent populations, for whom the combination of rapid physical development and hectic schedules can result in highly variable glucose levels (Borus & Laffell, 2010; Datye et al., 2015).
With the recent changes to telehealth reimbursement policy, health systems can use Glooko’s solution to identify patients at risk for severe hypoglycemia at the cadence that they choose (e.g. every 7 days. 30 days, etc.), and subsequently schedule a newly reimbursable virtual visit, resulting in timely patient care while mitigating the patient’s (and payer’s) risk of incurring a costly hypoglycemia-related ER visit.
To easily identify this patient cohort, you can use Glooko’s Age, Time CGM Active and Hypoglycemia filters.
2. Find patient candidates eligible for Remote Patient Monitoring
To run a viable RPM program, health systems must rigorously evaluate which patients are “at risk” and likely to benefit from additional care and which patients generate an adequate amount of qualified data (a minimum of 16 days worth of remotely transmitted data every 30 days is required for certain RPM reimbursement codes).
Using the Cohort feature, you can easily identify patients that meet both criteria. For example, an ideal RPM cohort might be patients that have an Average BG over 250 mg/dL over the last 30 days (cohort may benefit from RPM care) that also check their blood sugar more than 1 time per day (cohort meets the data threshold for reimbursement).

3. Manage hyperglycemia for patients enrolled in the RPM program
Once patients are enrolled in an RPM program, the Cohort feature allows for easy identification of patients experiencing conditions such as hyperglycemia among patients 65 or older with Type 2 diabetes. Upon identification, clinicians can intervene to manage hyperglycemia through a combination of lifestyle coaching (diet & exercise) and/or medication adjustments.
Once a cohort has been found, Glooko offers various methods for identifying each patient that is included in that cohort and taking the appropriate actions for those patients. Stay tuned for Glooko’s next blog to learn more!
References
- Borus JS, Laffel L. Adherence challenges in the management of type 1 diabetes in adolescents: prevention and intervention. Curr Opin Pediatr. 2010;22(4):405-411. doi:10.1097/MOP.0b013e32833a46a7
- Botsis T, Hartvigsen G, Chen F, Weng C. Secondary Use of EHR: Data Quality Issues and Informatics Opportunities. Summit Transl Bioinform. 2010;2010:1-5. Published 2010 Mar 1.
- Bronstone A, Graham C. The Potential Cost Implications of Averting Severe Hypoglycemic Events Requiring Hospitalization in High-Risk Adults With Type 1 Diabetes Using Real-Time Continuous Glucose Monitoring. J Diabetes Sci Technol. 2016;10(4):905-913. Published 2016 Jun 28. doi:10.1177/1932296816633233
- Datye KA, Moore DJ, Russell WE, Jaser SS. A review of adolescent adherence in type 1 diabetes and the untapped potential of diabetes providers to improve outcomes. Curr Diab Rep. 2015;15(8):51. doi:10.1007/s11892-015-0621-6
MKT-0112 01
Glooko users show a slight trend toward better glucose control during the pandemic.
People with diabetes face a greater chance of experiencing serious complications caused by the coronavirus. To understand the impact of COVID-19 on people with diabetes, we analyzed glucose, insulin, and activity trends from users of Glooko solutions in the United States. We have measured data before and after mid-March, when the COVID-19 pandemic was declared as a national emergency and most state-level shelter-in-place orders came into effect.
Our main takeaways from the data analysis are that after shelter-in-place started, weekends and weekdays blend together when it comes to blood glucose levels. We also see a slight trend toward better glucose control and slightly lower and more consistent carb intake. There is however no change in insulin amounts.
To support people with diabetes and healthcare providers during the pandemic, we are offering a secure, privacy-protected remote-care solution at no charge to enable safe, connected patient care. This solution allows individuals to access ongoing medical care with their healthcare providers by facilitating remote appointments. People with diabetes are also able to track their glucose, insulin, and lifestyle data such as food and activity right in the Glooko Mobile app.
KEY TAKEAWAYS
Weekends and weekdays blend together
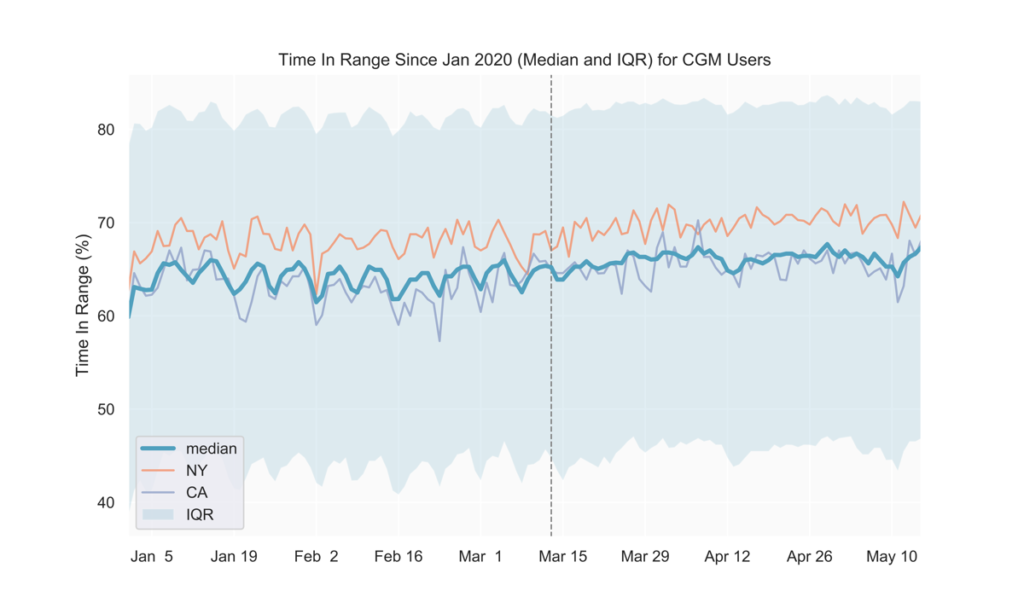
Prior to COVID-19-related shelter-in-place orders across the United States (around mid-March), we observed a weekly pattern consisting of relatively higher average blood glucose on the weekends, with the peak happening on Sundays. Similarly, time in range (TIR) for CGM users tended to be highest during the week and lowest on Sundays. Starting in early to mid-March, average glucose values decreased and the daily fluctuations over the week became less pronounced (Fig. 1, 2). Average glucose and TIR on weekends eventually resembled weekday levels pre-COVID-19 (Fig. 1, 2, 3).
The data show that since the national shelter-in-place order was implemented in the US in mid-March, the day-to-day fluctuations in glycemia that previously showed a weekly pattern began to dissolve, presumably as the day-to-day lifestyle and behavior on weekdays and weekends became increasingly similar.
Note: the slight peak in average glucose on April 12-13 corresponds to Easter Sunday and Monday.
Fig 1.
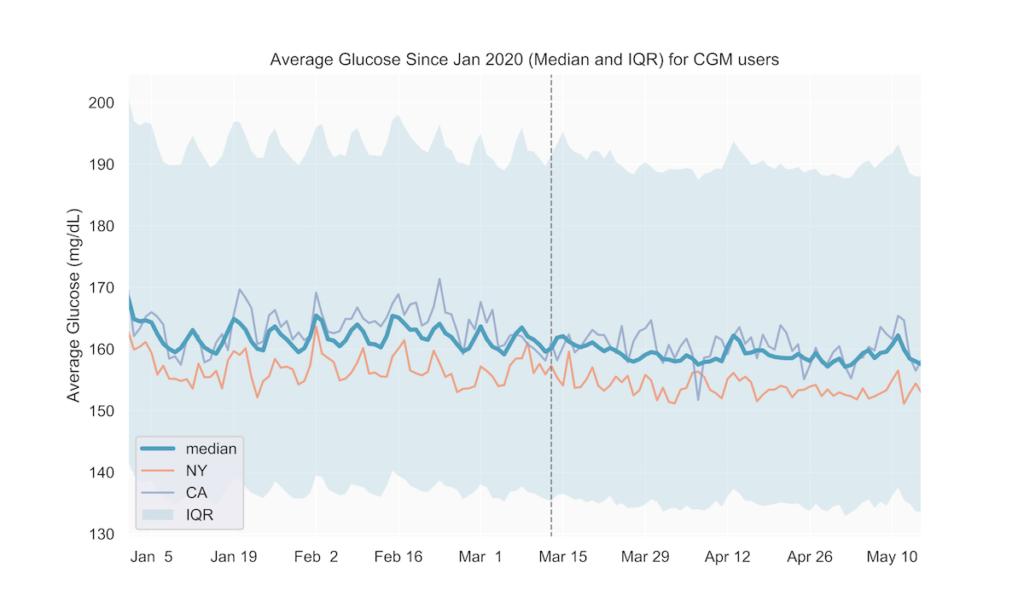
Fig 2.
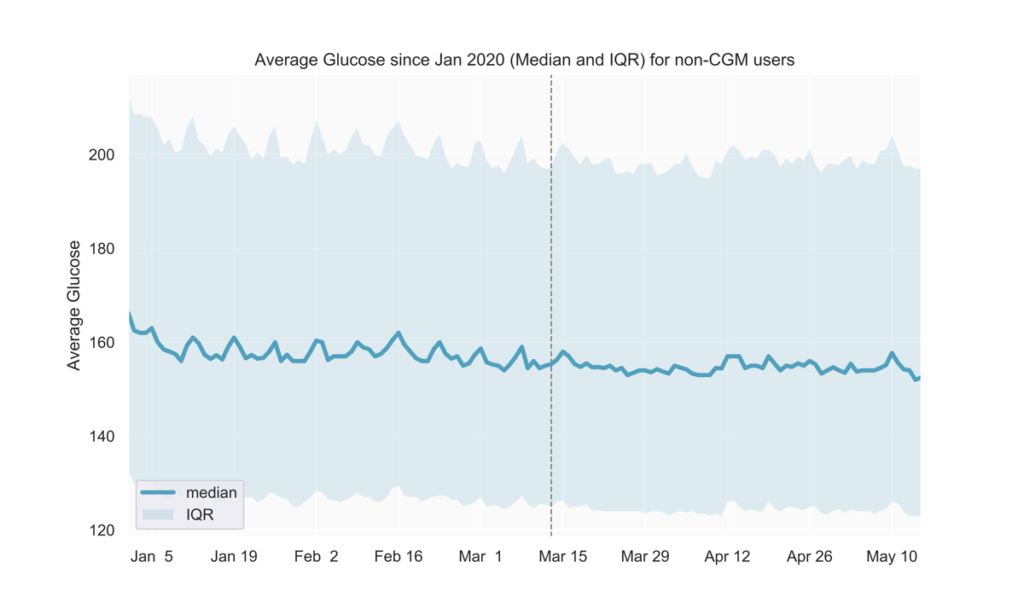
Fig 3.
Slight trend toward better glucose control
After mid-March, we observed lower average blood glucose levels and hyperglycemia rates, along with slightly higher TIR (Fig. 1-4). These could possibly result from staying at home leading to people with diabetes having more time for diabetes management.
Fig 4.
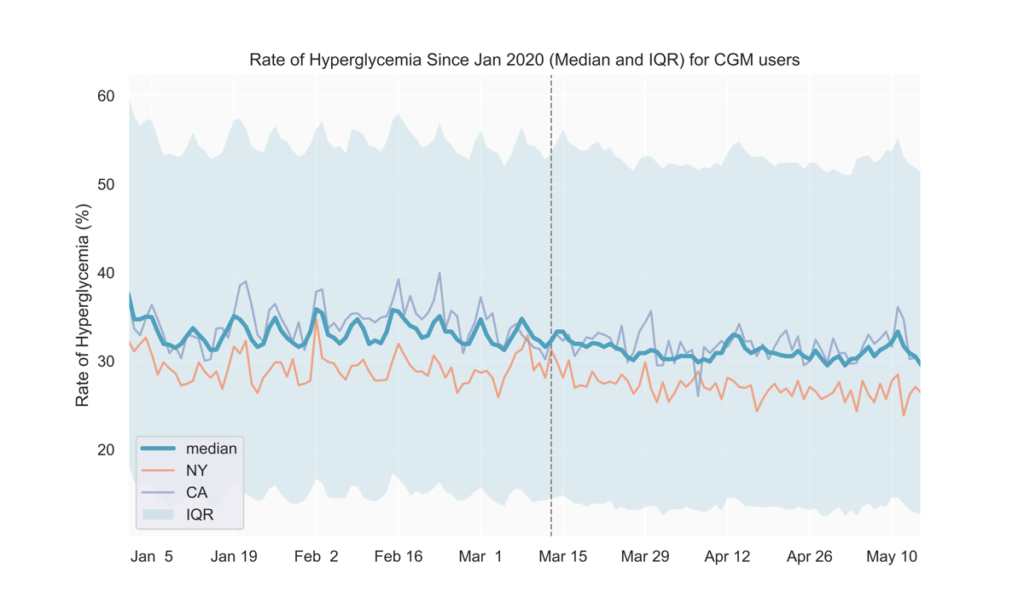
See the tables below for comparisons of glucose outcomes before and after March 13 (when the Federal emergency was announced). The differences in TIR, average glucose, and rate of hyperglycemia were statistically significant (p<0.0001).
| CGM users | Pre March 13 (3-week period) |
Post March 13 (3-week period) |
| TIR mean (IQR) | 62.3% (49.3, 76.5) | 63.3% (49.8, 78.2) |
| Average Glucose mean (IQR) | 166.4 mg/dL (142.8, 186.4) | 164.6 mg/dL (140.2, 185.3) |
| Rate of Hyperglycemia mean (IQR) | 35.3% (19.8, 49.3) | 34.3% (18.1, 48.6) |
| Non-CGM users | Pre March 13 (3-week period) | Post March 13 (3-week period) |
| Average Glucose mean (IQR) | 169.2 mg/dL (132.1, 195.4) | 167.5 mg/dL (129.5, 194.1) |
States with early adoption of shelter-in-place directives align with national trends
We also analyzed the above metrics at the state level to find out if shelter-in-place impacts on lifestyle and glycemic management in individual states affect our users’ glucose differently than the national average. As seen in Fig. 1 and 3, states adopting shelter-in-place relatively earlier (e.g., NY, CA) do not seem to show deviations from the national trends thus far. We will continue to track individual states as they gradually reopen to detect if any new trends emerge in the next few weeks.
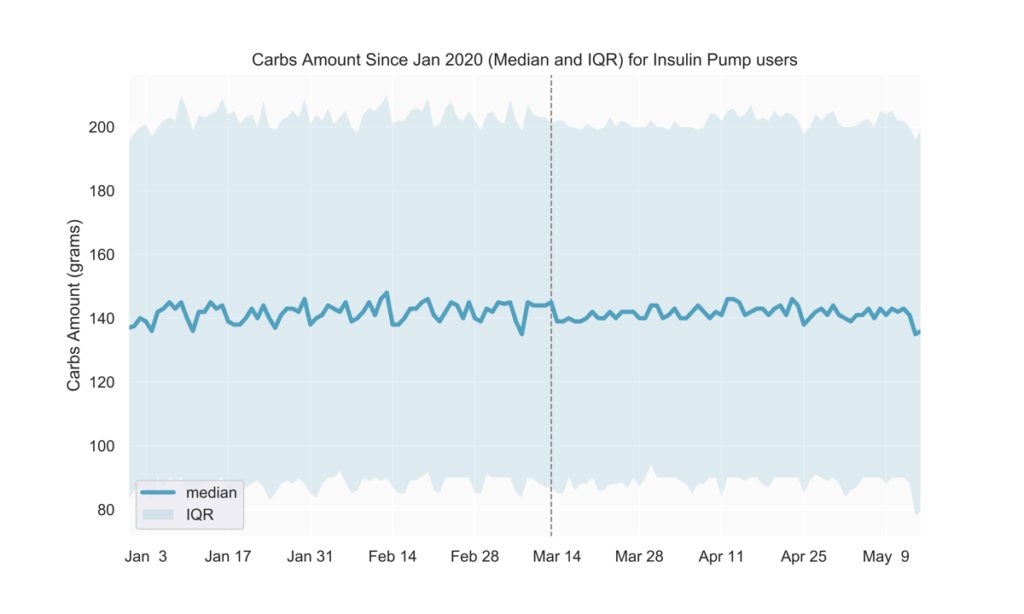
Slightly more consistent carb intake
Pre-COVID-19, carb intake was generally lower during the week and higher on weekends. Among people with diabetes who are insulin pump users, we observed less pronounced daily fluctuations over the week following mid-March (Fig. 5).
Fig 5.
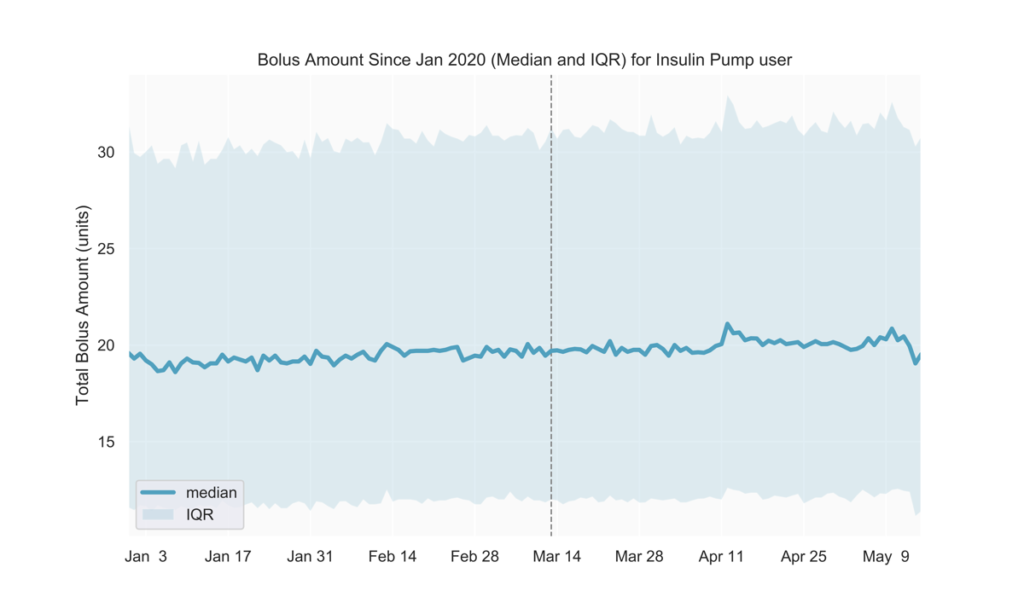
No change in insulin amounts
We observed no discernible changes in the total amount of daily bolus insulin dose among insulin pump users. We will continue to track insulin use to understand if possible disruptions in obtaining prescription drugs will reflect in users’ daily diabetes management. (Fig 6)
Fig 6.
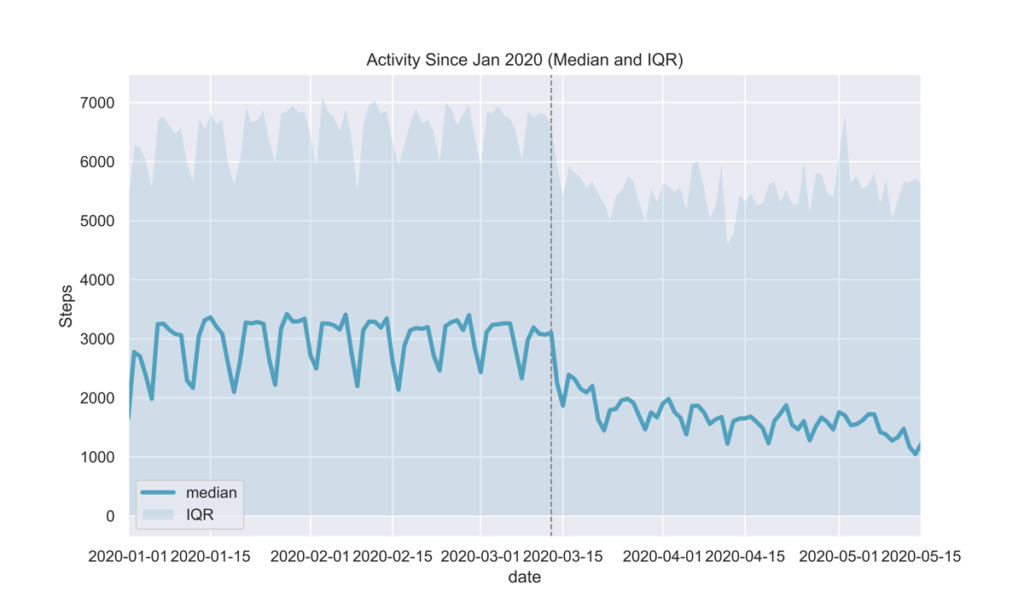
Decreased activity
Glooko users are able to easily track their activity and how it affects their glucose by connecting their preferred activity trackers and apps to the Glooko Mobile app. By analyzing daily steps, we observed a drop in activity post-March 13 as seen in Fig. 7. This was an expected outcome given national shelter-in-place orders in the USA.
Fig 7.
METHOD DATASET
Glucose, insulin, and activity data were sampled from in-clinic and at-home Glooko users in the USA between January and April 2020, and analyzed separately for two main cohorts:
- CGM users: People with diabetes who use a continuous glucose monitoring device,
- non-CGM users: People with diabetes who rely on glucose meters and/or insulin pumps for their diabetes management.
INCLUSION CRITERIA
This analysis included CGM users who had at least 144 CGM readings on any given day, and non-CGM users who had at least 1 glucose reading on any given day.
DEFINITIONS
- Average glucose
- non-CGM users: the average value of glucose readings on a given day in mg/dL
- CGM users: average estimated glucose value on a given day in mg/dL
- Time In Range (TIR), reported only for CGM users: the percentage of estimated glucose values between 70-180mg/dL on a given day
- Rate of Hyperglycemia reported only for CGM users: the number of readings above 180mg/dL on a given day
- Total Bolus Amount reported only for insulin pump users: the total units of insulin (normal and extended) on a given day
- Carbs Amount reported only for insulin pump users: the total amount of carbs that were entered into the insulin pump on a given day
MKT-0213 01