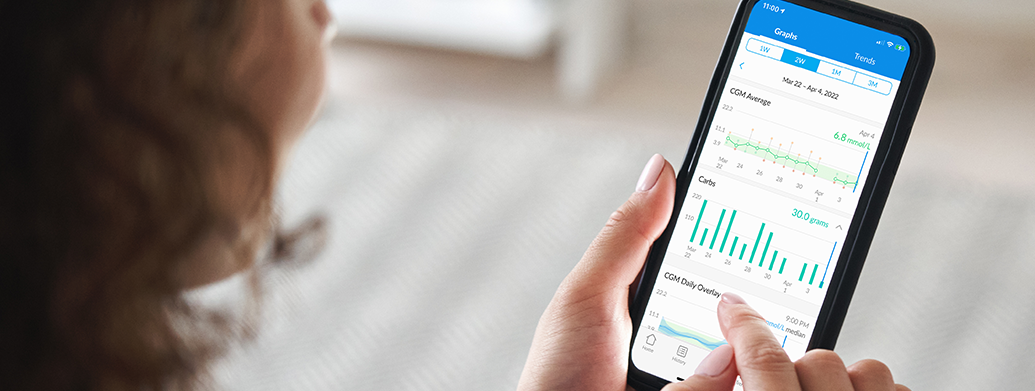
People with diabetes who use the Glooko® app receive insights about their diabetes and easily share their diabetes data with their care teams. Within the clinic setting, the Glooko® Population Tracker allows the clinician to upload and view diabetes device data during appointments.
Glooko’s diabetes digital health solution with EHR integration enables care teams to streamline their diabetes care workflow and remotely monitor their patient population. Digital health companies collecting real-world health data (RWD) tend to focus on whether or not their users‘ health outcomes improve while engaging with their applications. However, most cannot measure what happens after users stop using their application („drop out“) because they do not have access to user data post-dropout.
This makes it difficult to understand if health outcomes decline, stay stable or improve after users stop using the application. This insight is valuable when analyzing the efficacy of a digital health application but is largely unavailable. If user outcomes generally deteriorate post-dropout, it suggests that the digital health solution plays a meaningful role in improving and sustaining outcomes. Conversely, if user outcomes continue to improve post-dropout, it could suggest that the digital health solution in and of itself may not be a critical driver of improved outcomes to begin with.
Glooko’s use within the in-clinic diabetes appointment workflow gives Glooko the unique ability to measure how health outcomes change for patients who drop out from using Glooko at home for diabetes self-management but keep their accounts active for use during their in-clinic appointments. Figure 1 (below) demonstrates the patient’s journey.
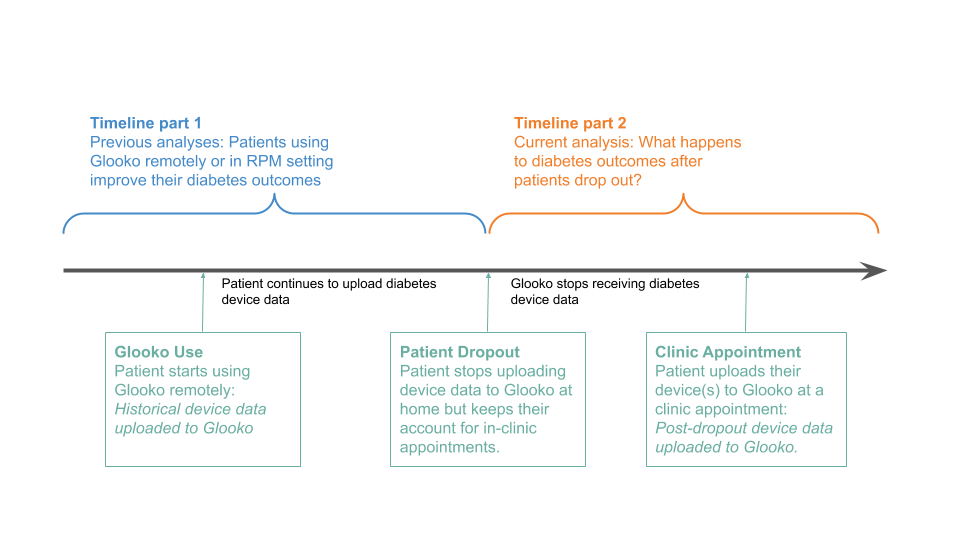
Figure 1. A Glooko user’s journey prior to and post-dropout.
When patients first begin using Glooko for diabetes management, Glooko downloads all historical glucose data stored on diabetes devices (this data was recorded by the patient prior to their Glooko use). This historical data is then compared to data recorded by the patients while using Glooko, which allows Glooko to analyze correlations between the patients’ use of the Glooko application and their changes in health outcomes (Figure 1, Timeline part 1). This pre-dropout analysis approach is common across digital health companies.
Glooko is also able to do a post-dropout analysis (Figure 1, Timeline part 2). After dropout, Glooko no longer collects patients’ diabetes data. However, most patients who stop using Glooko at home will typically continue to perform self-management and eventually visit their clinic for routine diabetes appointments. When clinicians upload those patients’ devices via Glooko’s in-clinic solution, Glooko obtains retrospective diabetes data for the time period between when the patients dropped out and their clinic appointments. This allows us to perform analyses on the second part of the timeline (shown on Figure 1: Current Analysis: What happens to diabetes outcomes after patients stop using Glooko remotely?).
Analysis & Results Summary
Across the 472 users analyzed we found that, on average, users who drop out (stop uploading data to Glooko and subsequently stop using Glooko) experience deteriorating diabetes outcomes. Compared to the two weeks prior to dropping out, at six to eight weeks post-dropout, we observed the following:
- An increase in average glucose by 5 mg/dL.
- An increase in percent of readings in hyperglycemia by 3%.
- A decrease in percent of readings in range by 1.7%.
- A 7.5% decrease in the number of daily glucose checks from an average of 4 to 3.7 readings.
The data suggests that patient dropout is correlated with future worsening diabetes outcomes. To prevent this, health systems implementing RPM programs can utilize Glooko’s ML-based Dropout Risk feature, which predicts, on a weekly basis, the risk that a patient will stop uploading their diabetes data to Glooko in the upcoming four weeks. Using this feature, health systems implementing RPM programs can identify which patients are at high risk of dropping out of the program and intervene ahead of time. This ensures continuity of care and smoother RPM program workflows while simultaneously preventing worsening outcomes.
Analysis & Results Deep Dive
In this analysis, we investigated self-monitoring glucose meter (SMBG) data from 472 Glooko users who met the following criteria:
- Used Glooko for at least six weeks by uploading their diabetes device data (SMBG and/or insulin pump devices) remotely; and
- Dropped out (stopped remotely uploading data to the Glooko platform after a minimum of six weeks of use while keeping their Glooko accounts for in-clinic appointments); and
- Had an in-clinic appointment after at least eight weeks post-dropout during which their data were uploaded to the Glooko platform.
We retrieved the patients’ glucose readings after dropping out to compare patients’ outcomes during the two weeks prior to and six to eight weeks post-dropout. Demographics are included in Table 1 (below).
|
Total N
|
Diabetes Type
|
Gender (for those who specified)
|
Age Median (IQR)
|
|
472
|
70% Type 1
11% Type 2
19% Other
|
53% Female
|
19 (13-47)
|
Table 1. Demographics of the cohort considered for analysis.
For each of the above metrics (average glucose, percent readings in hyperglycemia, percent readings in severe hypoglycemia, and daily reading count), we performed a paired student t-test comparing the two-week averages of the 472 patients during the two weeks prior to dropout to the two-week averages at six to eight weeks post-dropout. We deemed the hypothesis test significant (rejecting the null hypothesis that the two distributions are identical), if the resulting p-value was less than 0.05. I.e., we performed a statistical test to determine if there is a significant difference between the outcomes of this cohort prior to and post dropping out.
Average glucose increases after dropout
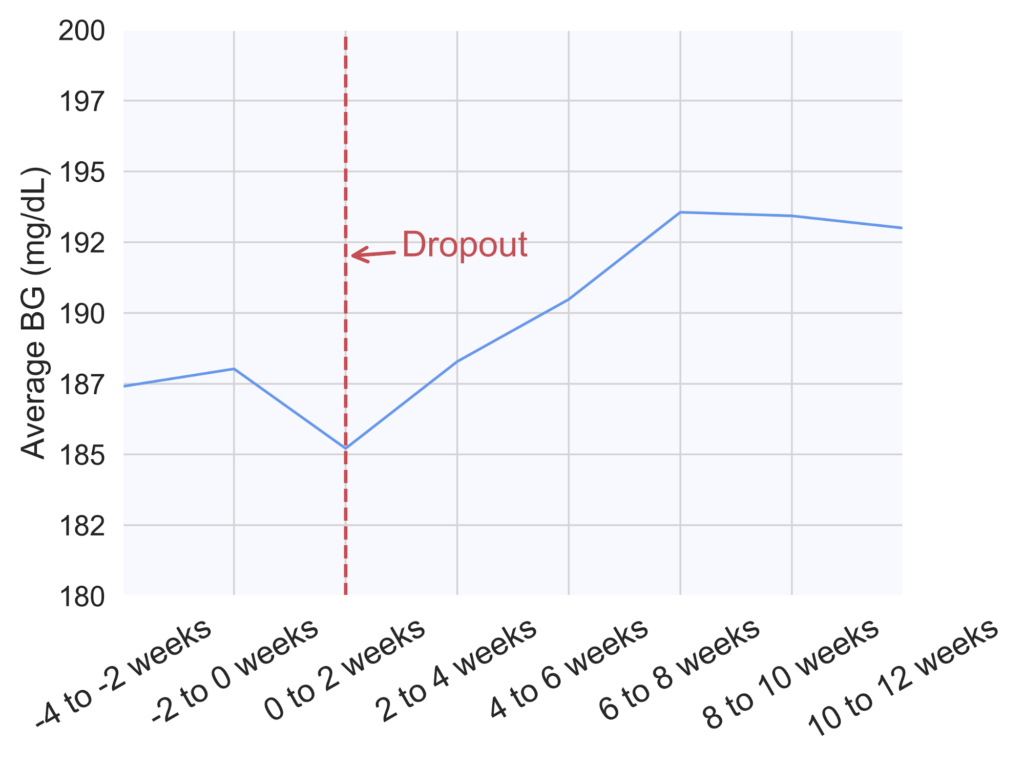
Average blood glucose (BG) values increased after dropping out. Patients experienced a steady increase in their average BG, reaching a plateau of approximately 193 mg/dL (value in mmol/L) at six to eight weeks post dropout, compared to 188 mg/dL (mmol/L) during the two weeks prior to dropout (Figure 2). This difference was statistically significant (p=0.004).
Figure 2. Average blood glucose (BG) in two-week increments across 472 patients prior to and post-dropout. The dropout week for all patients was aligned at 0 weeks (red dashed line), and week numbers are relative to the dropout week.
Percentage of readings in hyperglycemia and severe hyperglycemia increases after dropout, while the percentage of readings in-range decreases
The percentage of glucose readings that were in hyperglycemia (above 180 mg/dL) experienced a steady increase to reach an average of 47.5% at six to eight weeks post-dropout. Compared to the two weeks prior to dropout, this constitutes a 3% increase in hyperglycemia (Figure 3). This difference was statistically significant (p=0.02).
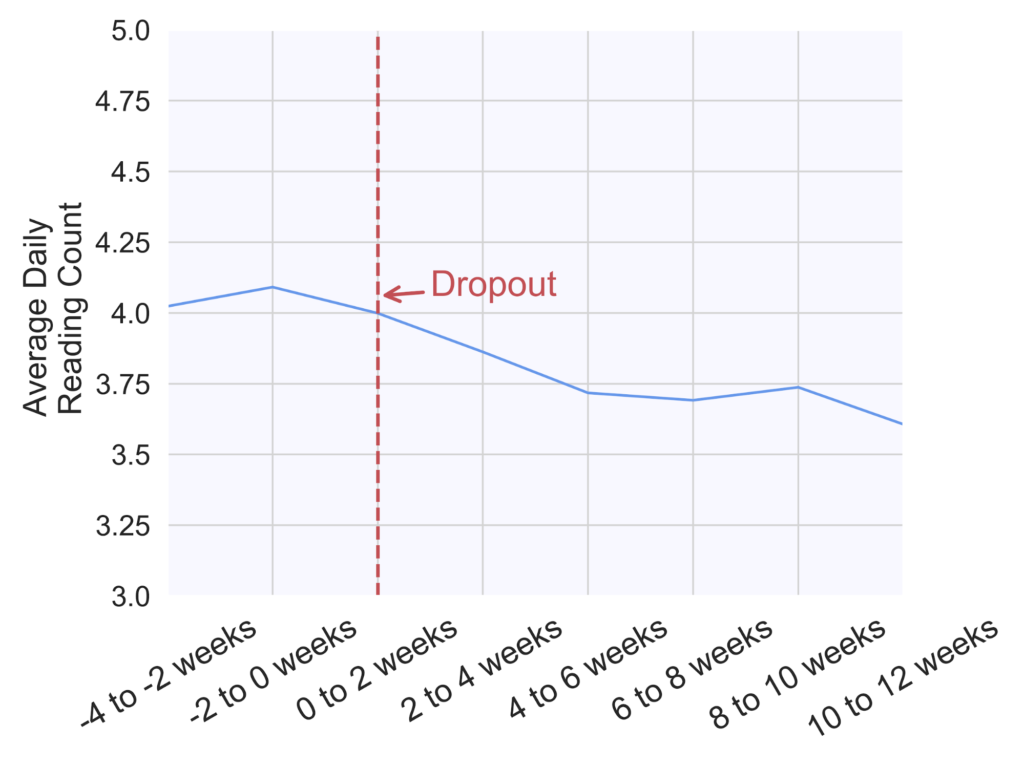
Figure 3. Percentage of readings in hyperglycemia (above 180 mg/dL) in two-week increments across 472 patients prior to and post-dropout. The dropout week for all patients was aligned at 0 weeks (red dashed line), and week numbers are relative to the dropout week.
Similarly, the percentage of readings in severe hyperglycemia (above 250 mg/dL) increased on average from 23.5% during the two weeks prior to dropout to 25% at six to eight weeks post-dropout (Figure 4). This difference was statistically significant (p=0.03).
Figure 4. Percentage of readings in severe hyperglycemia (above 250 mg/dL) in two-week increments across 472 patients prior to and post-dropout. The dropout week for all patients was aligned at 0 weeks (red dashed line), and week numbers are relative to the dropout week.
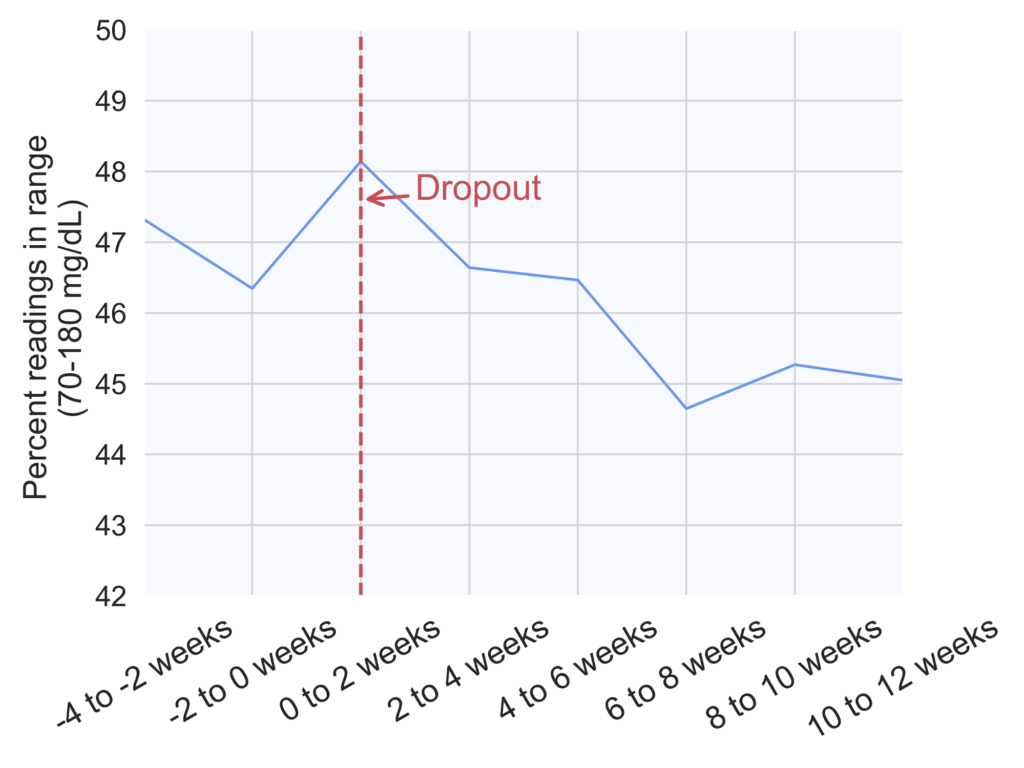
In parallel to an increase in hyperglycemia occurrence, we observed a decrease in the percentage of readings that were in the normal glucose range (70-180 mg/dL), as seen on Figure 5 (p=0.03).
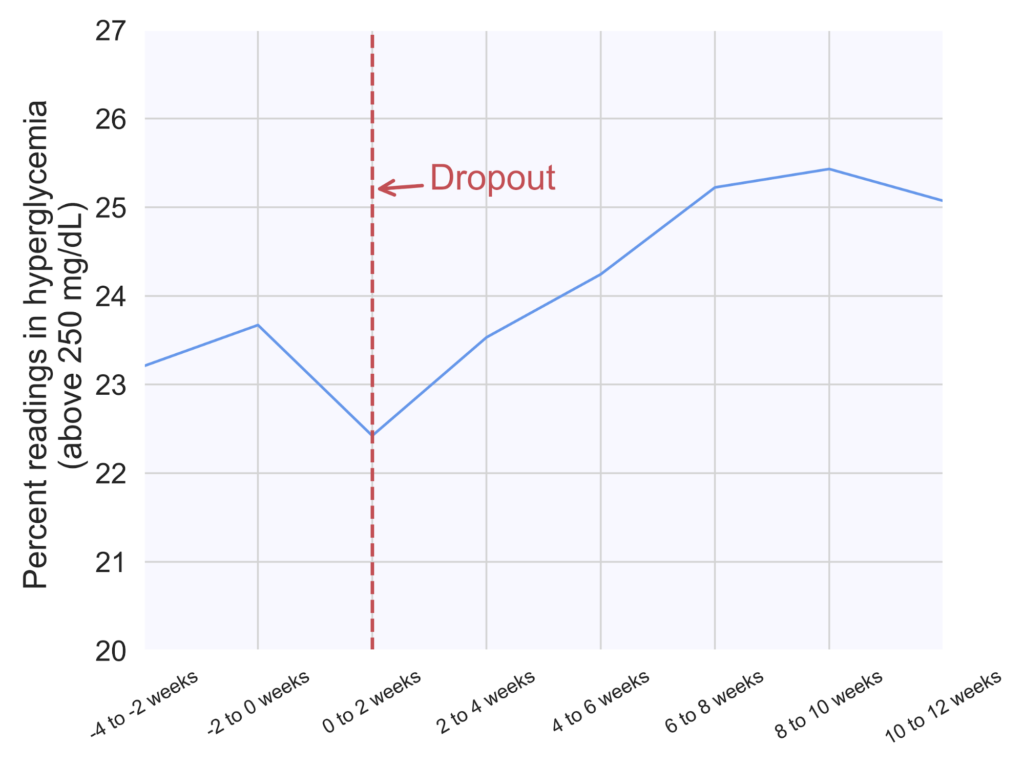
Figure 5. Percentage of readings in range (70-180 mg/dL) in two-week increments across 472 patients prior to and post-dropout. The dropout week for all patients was aligned at 0 weeks (red dashed line), and week numbers are relative to the dropout week.
The average number of daily glucose checks slightly decreases
Finally, the number of daily glucose checks experienced a 7.5% decrease from an average of four checks per day during the two weeks prior to dropout to 3.7 checks per day at six to eight weeks post-dropout (Figure 6). This difference was statistically significant (p<0.00001).

Figure 6. Average number of daily glucose checks in two-week increments across 472 patients prior to and post-dropout. The dropout week for all patients was aligned at 0 weeks (red dashed line), and week numbers are relative to the dropout week.
We did not find any discernible differences in the average percentage of readings in hypoglycemia.
MKT-0244 01

