
 Weltweit
  Deutschland
  Spanien
  Frankreich
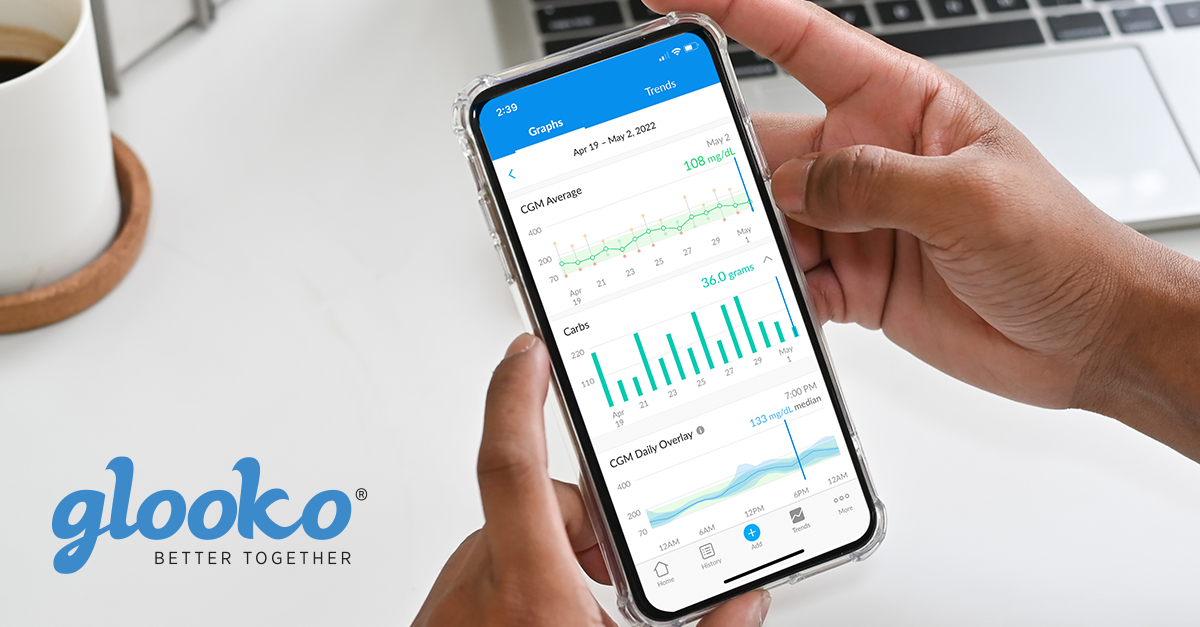
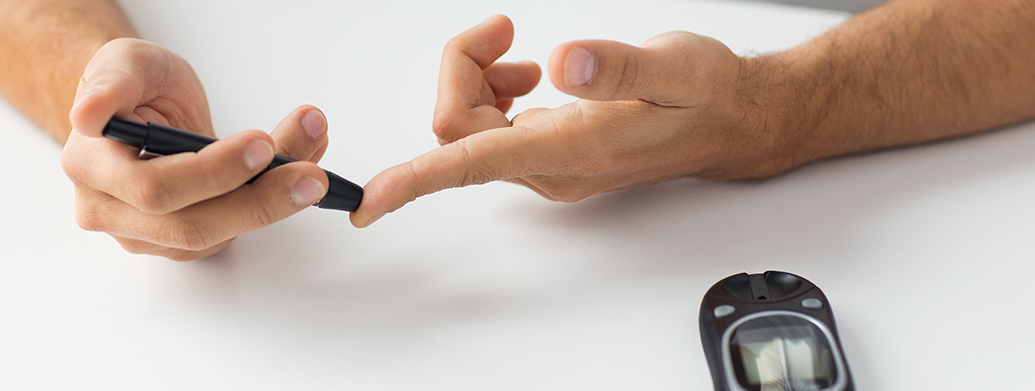
Impacting Diabetes in Asia, One Person At A Time
She is a mom of two kids ages 12 and 8 and a loving wife. She is an HR Specialist who works 4 days a week, a special arrangement with a supportive boss. She watches her diet and plans to get an activity tracker soon. Her motto is „Take care of your diabetes, so you are able to take care of everything else.”
Meet Lynette. Lynette has Type 1 diabetes (T1D) and has been living with T1D for over 30 years. She lives in Singapore. She was diagnosed in the 1980s when the practice of frequent blood sugar testing was not available. Growing up with diabetes at a time when technology was just starting to be available in Singapore put her in and out of hospitals frequently either due to hypoglycemia or hyperglycemia. It was not only personally hard, it was expensive.
As she got older, she learned to better manage her diabetes with skills she learned from her healthcare team, but Lynette also set out to make it easier – she was determined. And that is when she found Glooko.
Through our reseller in Singapore, Aeras Medical, we got to interview Lynette for our blog. There are many nuggets of inspiration and wisdom in Lynette’s thinking.
Tell us about your experience with diabetes:
I was diagnosed during childhood and have been living with type 1 diabetes for 36 years. I take multiple insulin injections daily and have achieved below a 7% A1C for the last 5 years!
Tell us about your determination to stay healthy and to keep your diabetes under control:
In 2013 I had to have carpal tunnel surgery. That experience was a wake-up call for me to focus more on diabetes control so I could minimize and even avoid the many complications that arise if you don’t have good control. On top of that, I have seen many people with diabetes in my country have to have part of their legs amputated due to diabetes complications and I didn’t want that to be me.
I am also determined to not let my diabetes be an obstacle to what I want to achieve in my life. I want to be in charge of my future and my health and not let my diabetes take charge of me.
So how do you stay in charge?
To be in charge, I need to know how my blood sugar is doing and how my diet, exercise and insulin doses affect my blood sugar. Before Glooko, I had to keep track of this by writing it down and it was hard. Now, through Glooko, it is easier and I can share it with my healthcare team so we can work on strategies to improve.
It’s interesting, a key benefit to me of tracking my blood sugar is that it made me more likely to check my blood sugar more frequently. I stopped assuming what it was and starting more proactively checking. I became more “ok” with imperfect BG readings because I knew more about why I was out of range. I came to grips with the fact that only people without diabetes have perfect blood sugar levels, and those of us with diabetes just need to know so we can manage it.
What are the daily challenges you and your family face related to diabetes?
For me, the challenge is juggling my blood sugar and my family obligations and my work responsibilities. One thing that I have learned is that I can be open about it. I frequently check my blood sugar openly in my office and my colleagues are very supportive and understanding. I also am more aware of the need to encourage my family to lead a healthy lifestyle to avoid diabetes and other health problems.
After many years of living with diabetes, I learned that diligence is really the only way to overcome challenges. After many adjustments, I now have a routine related to how and when I take my insulin, what I eat and when I check my blood sugar – which can be 5-6x per day.
How do you stay educated about diabetes and your care plan?
Using my data, I am able to review my care plan, and even clarify my questions about my plan when meeting with my doctor. I am also an avid reader and often read about diabetes best practices online. I attend diabetes programmes hosted by local hospitals and also attend a support group. I make it a point to read the nutritional content of the food I eat and even attended nutritional classes to help me understand my nutrition better.
What did you use before Glooko?
Before I knew about the Glooko app, I used manual recording BUT, I was not able to record manually every detail. It was just too time consuming and tedious. The excel worksheet I used did not easily summarise my blood sugar and insulin data and didn’t allow me to see trends.
With the Glooko app on my mobile phone, it is easy for me to record when I take my insulin, what food I eat, and how and when I exercise. And the ability to directly sync my blood sugar with Glooko directly with my meter makes my life much easier. And to top it off, my healthcare team can see my Glooko information in their computer system without any additional work!
What are some of the things Glooko helps you do?
With Glooko, I understand under what conditions I tend to go low. Knowing that, helps me to use things like the rule of 15 to manage my hypoglycemia. I also realized that a simple 20 minute brisk walk, 3 times a week works wonders for me to have better blood sugar levels. It also improves my circulation, helps to make me more energetic and gives me a chance to clear my mind!
Glooko also helps me get better at knowing the impact of my insulin doses. I know that I am not so great at estimating the carb content of my lunch when I eat out and am more careful about it now.
I view the Glooko weekly trends and statistics regularly to compare and improve. The Joslin Hypomap with Glooko is very useful as it allows me to identify the causes of hypoglycemia and what I do to treat it. It also gives me clarity around the frequency of my hypoglycemia.
What features should Glooko offer next?
Glooko should allow the user to repeat or set the insulin units for those of us who use MDI. It should allow us to add in the time of insulin injection and the type – all in one screen.
Do you see yourself using Glooko for the long term?
Yes! Glooko is a long term tool for me. It’s an important part of each day and my diabetes control plan. Since the cost of living with diabetes in Singapore is high and almost not well subsidized, I hope the long term cost of using Glooko will be minimal!
Individual Differences in Fasting Blood Glucose (FBG)
A fasting blood glucose (FBG) reading between 70-100 mg/dL is typically regarded as normal in people without diabetes1. While this range serves as a standard reference for assessing one’s glycemic status, inter-individual differences exist across the population. A better understanding of one’s own FBG range might provide a more actionable basis for reference.
Mobile health (mHealth) technologies such as diabetes management apps allow one to track his/her own blood glucose data. Access to this data gives the user a more detailed understanding of their own FBG profile and range. This can be leveraged to help users make more appropriate lifestyle and behavior choices in diabetes management.
To demonstrate how mHealth diabetes management tools like the Glooko mobile app can help me understand my glycemic status better, I self-monitored my blood glucose (SMBG) levels over the last month or so. I then queried my own user data from the Glooko secure database to see if I can learn something interesting about my own FBG levels.
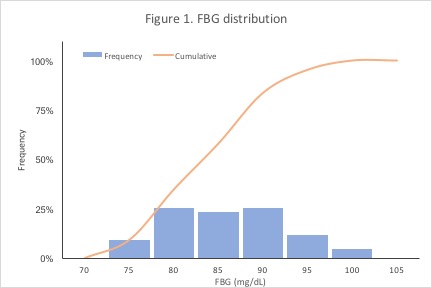
First, I was interested in how my FBG distribution looked. Figure 1 shows the relative and cumulative frequencies of my FBG readings, binned from 70-105 mg/dL. My FBG readings centered around 80-85 mg/dL (median = 82 mg/dL), and 75% of my FBG readings were 89.5 mg/dL or lower. My FBG readings were well within the reference range of 70-100 mg/dL – an expected finding for someone without diabetes.
Next, I was interested in knowing a little bit more about the dispersion (or spread) of my FBG readings. In particular, I was curious about my middle 50% (interquartile range; IQR) and middle 95% FBG ranges. The IQR and middle 95% ranges are indicators of the central majority of my FBG readings. Figure 2 shows that my IQR was 78.5-89.5 mg/dL and my middle 95% was 75-95 mg/dL. Collectively, these findings indicate that the central majority of my FBG levels occupy a slightly narrower range than the 70-100mg/dL reference.
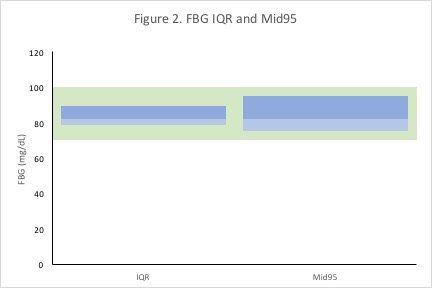
In having this more nuanced understanding of my typical FBG range, I can customize my Glooko app dashboard to reflect these ranges instead of the default/standard range. Knowing my individual FBG range helps me interpret my FBG data in a more meaningful way.
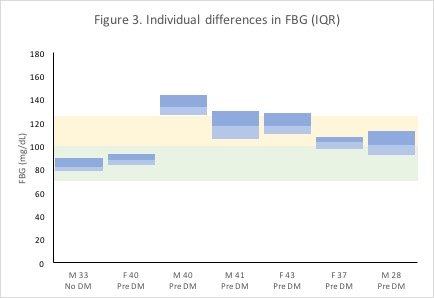
Because inter-individual differences exist in the population, being able to leverage one’s own data can be important for informing more appropriate behavior and more targeted treatment. After all, what’s considered a typical/healthy FBG range for one individual might not necessarily be considered typical/healthy for another. To gain an appreciation of the extent of individual differences in FBG, I queried the Glooko user base for data from Glooko users who were within 10 years of my age and self-identified as having pre-diabetes to qualitatively compare my FBG range.
Among six randomly-selected users that fit the query criteria, we can see appreciable differences in users’ average FBG levels and the extent of variation in users’ FBG readings (Figure 3). Median FBGs ranged from 88 mg/dL to 133 mg/dL (user 1: 40 yo female; user 2: 40 yo male), and the IQR widths ranged from 9 mg/dL to 24 mg/dL (user 1: 40 yo female; user 3: 43 yo female). For a visual comparison, my FBG IQR from Figure 2 is shown in the first column in Figure 3, juxtaposed to other users’ FBG IQRs in the subsequent columns. Given this much variation across individuals, using individualized FBG reference ranges might be more helpful for more precise diabetes management.
In the figures above, I leveraged real FBG data to show how mHealth tools can help improve someone’s lifestyle and behavior choices in diabetes management. Taken together, these findings demonstrate the extent to which individuals can differ in their FBG ranges and describe the importance of tracking an individual’s own SMBG/FBG data to generate actionable insights. For people with diabetes, this might enable better management practices. For those who have pre-diabetes, this might mean preventing or delaying the onset of diabetes. Going forward, I am excited that innovative mHealth diabetes management platforms such as Glooko can help people track their blood glucose data more easily and manage their diabetes better.
1„Diabetes Tests and Diagnosis.“ Mayo Clinic. Mayo Foundation for Medical Education and Research, 31 July 2014. Web. 21 June 2017.
This blog is not intended to be a substitute for professional medical advice, diagnosis, or treatment. Always seek the advice of your healthcare provider with any questions you may have regarding your medical condition.
Nutrition Recommendations from a Registered Dietitian
Nutrition is extremely important for everyone, especially if you have diabetes. Some of us look at the nutrition facts on food labels and count calories, fat, carbohydrates, sugars, and protein. Some even study the ingredients to avoid artificial flavors and refined sugars. Whether you do these things or not, we all have room for improvement when it comes to nutrition, but where do we start?
To learn more about this topic, I reached out to Linda Hittleman, a registered dietitian (RD) and certified diabetes educator (CDE). Linda has been a practicing dietitian for over 25 years and also teaches nutrition classes at Nassau Community College in New York.
Daniella: What are some important things to keep in mind about nutrition?
Linda: It’s cliche to say this, but you are what you eat. If you follow a healthy diet, you won’t necessarily be protected from illness and diseases, but there is scientific evidence that shows you may decrease the impact. If you just eat high-calorie, processed foods without much nutritional value, you are more prone to weight gain, type 2 diabetes, hypertension etc.
Daniella: Is there a recommended diet for a person with diabetes (PWD)?
Linda: Yes, there is.
Like all of us, people with diabetes (PWDs) need to get energy from an outside source: food. For PWDs, it’s important to focus on the amount of carbohydrates consumed. I recommend carb counting in the beginning and not excluding heart healthy foods that contain carbohydrates. A registered dietitian/certified diabetes educator can help PWDs figure out the right amount of carbohydrates to consume, taking medication and activity level into consideration.
People with T2D should minimize processed carbohydrates such as white flour, white rice, white pasta, starches, and anything with added sugar. Processed carbohydrates tend to break down rapidly and cause a quick rise in blood sugar, which may require more medication to keep blood sugar levels under control. Eating too many processed carbohydrates may also make it harder to control weight, I encourage healthier forms of carbohydrates like whole grains, beans, fresh fruits and vegetables. Besides causing a slower rise in blood sugar, they may also help you feel full longer due the slower breakdown of carbohydrates and added fiber. Plus they are chock full of nutrition!
PWDs are also at higher risk for cardiovascular disease and would benefit from a Mediterranean style diet which consists of more a plant based diet and healthy sources of fats such as olive oils, avocados, nuts and seeds. Lean proteins and fatty fish are also recommended. Ultimately, maintaining and watching calorie intake is very important for those with T2D. Using websites such as eatright.org can help with meal planning. I also encourage some type of activity daily because it makes a difference in not only blood sugar numbers, but weight and overall well-being.
For those who want a snack, I recommend something low in carbs such as a cheese stick, a handful of nuts, greek yogurt, hard boiled eggs, or veggies and hummus. I stress a plant-based diet. This doesn’t mean going vegetarian or vegan, in fact, incorporating lean protein is also beneficial, whether it’s animal or plant-based. I also recommend that people limit french fries, soda, and fast-food. Instead, stock up on sweet potatoes, eggs, greek yogurt, beans, olive oil, fresh or frozen fruits and veggies, grains such as quinoa, and tuna.
Daniella: What are some common mistakes PWDs make in meal-planning?
Linda: PORTION CONTROL! People can be either too strict or too generous with their portions. I recommend measuring food using scales and spoons, then putting it on the table so you have an idea of what a real portion looks like. That way, when you’re at a restaurant, you’ll know an appropriate amount to eat. Also, some PWDs cut out complete food groups like fruits and vegetables. This is a HUGE mistake.
Daniella: What is the best way to approach calorie counting?
Linda: My personal approach is to figure out approximately how many calories a person requires and then figure out how many servings of foods they can choose from each group. I think this is specific to a person and also depends on whether a person is on medication, exercises, etc. Once you find the right balance, I calculate how many calories the person needs each day to reach a target weight and then divide it into however many meals and snacks they consume daily.
Balance is the key. A sedentary person can have seven small meals a day and it would be a disaster because they would be constantly eating and not knowing how much was eaten. However, athletes, or people who are very physically active, can eat this way because their bodies need the constant energy. It’s important to remember that all carbohydrates break down into glucose in the bloodstream, not just the processed ones.
Lastly, I strongly suggest that people communicate with their medical team and meet with a dietitian to help with meal planning. Not all dietitians are certified diabetes educators, but they can get the ball rolling. It’s all about communication and education since everyone is different. See what works and what doesn’t work for you. Nutrition has a huge impact on our lives and overall health. Eating healthy is a key step in managing your health, and is especially important if you live with diabetes.
This blog was created for informational purposes only and represents the professional experience of Linda Hittleman, RD CDE. It is not intended to be a substitute for professional medical advice, diagnosis, or treatment. Always seek the advice of your health provider with any questions you may have regarding your medical condition.
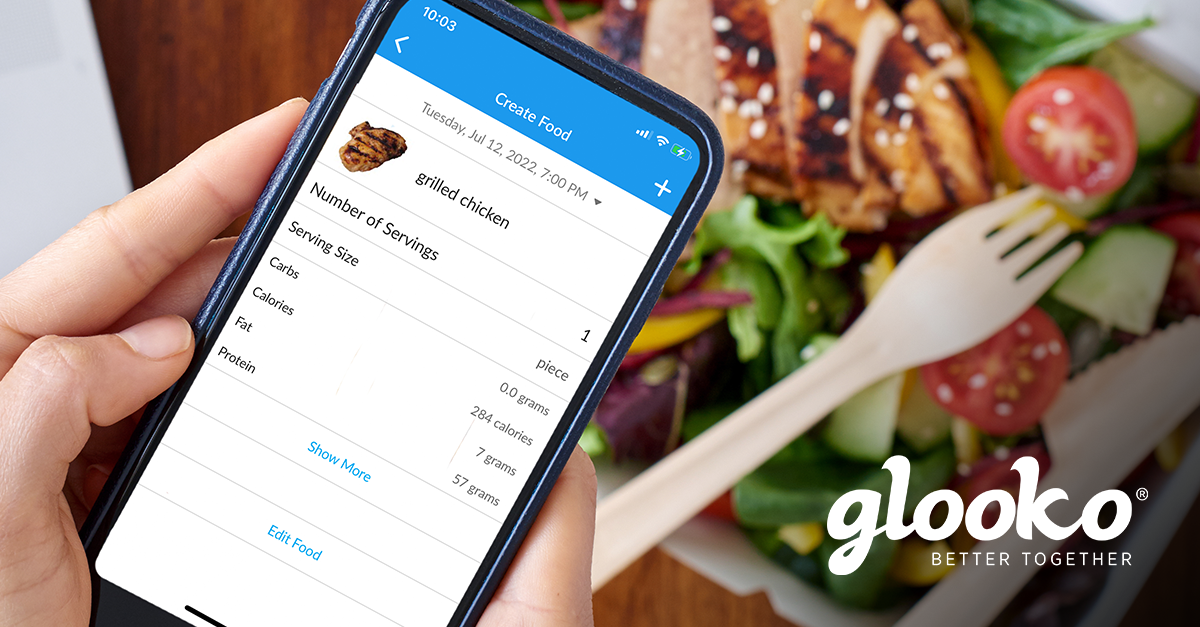
Steven Shares How He Tracks His Carb Intake with Glooko
Tell us about yourself.
My body was not metabolizing what I was eating because my pancreas wasn’t working. As a result I had a Whipple procedure on January 3, 2006. At this time, I was still not a diabetic. On July 7, 2008, I retired from my job as an Educational Administrator for the New York City Department of Education. Exactly one day later, I had a total pancreatectomy and became insulin dependent (PWD T1).
Tell us about your diabetes.
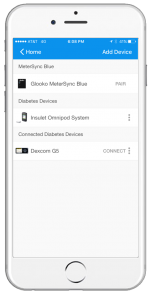
I was put on insulin immediately after the completion of the total pancreatectomy surgery and started by injecting it, but then moved to the Omnipod® System because it was much easier for me to manage my insulin. I noticed that whenever I had low blood sugar, I would also break out into a sweat, but then not too long after, the typical symptoms of a low blood sugar went away and it was hard for me to know what was going on. This prompted my doctor to put me on the Dexcom CGM.
Hobbies?
Lifelong volunteer serving the youth of my community through the Boy Scouts of America. I enjoy being in the outdoors. Whether in the woods camping and hiking or walking 2-5 miles a day in my neighborhood. I spend a lot of quality time with our 2 grandsons.
Favorite Food?
I enjoy cooking. I love making my breakfast of egg white omelets with fresh vegetables and cheese or cereal with yogurt and fresh fruit. For lunch, besides making sandwiches, I make homemade chicken or turkey vegetable soup. For dinner, my wife usually cooks the dinner but on occasion, I make my shrimp or chicken stir fry. When dinning out I enjoy Asian, Italian, Greek and Middle Eastern Foods.
How did you hear about Glooko?
I’ve been using Glooko for over a year now, after I heard that Insulet was sponsoring Glooko for Omnipod® System users. I have an Android phone so I’m able to download my Omnipod® System and Dexcom® CGM data directly to my phone using Glooko.
Why Glooko?
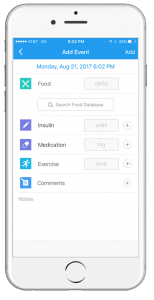
I love it since it allows me to carb count more easily. I save my favorite foods so I can access it from the food database quicker. The Omnipod® System food database was lacking and I like that Glooko allows me to search for specific brands like Kirkland. I’ve luckily been able to find every type of food that I’ve searched for using the Glooko app. The Glooko food database is also nice because in addition to carb details, I can see other nutritional information like fiber and calories The Glooko statistics also allow me to compare my blood sugar trends from week to week and month to month. Now, I’m able to see at a glance not only what I’m eating, but also my insulin usage. It has also been super convenient! Since Glooko is on my phone, I can take it from my kitchen to my living room and so on.
What’s the best thing you have learned or advice that you want to share for navigating through diabetes?
I am not afraid to ask questions to the members of my medical team. I do plenty of research on line but check the validity of the sources. I have joined and check in on different diabetes blogs and Facebook groups. Every day I remind myself that I am not perfect in managing my diabetes but I am doing my best. I have to manage and live with my diabetes 24/7/365.
Thanks for sharing your story with us, Steven!
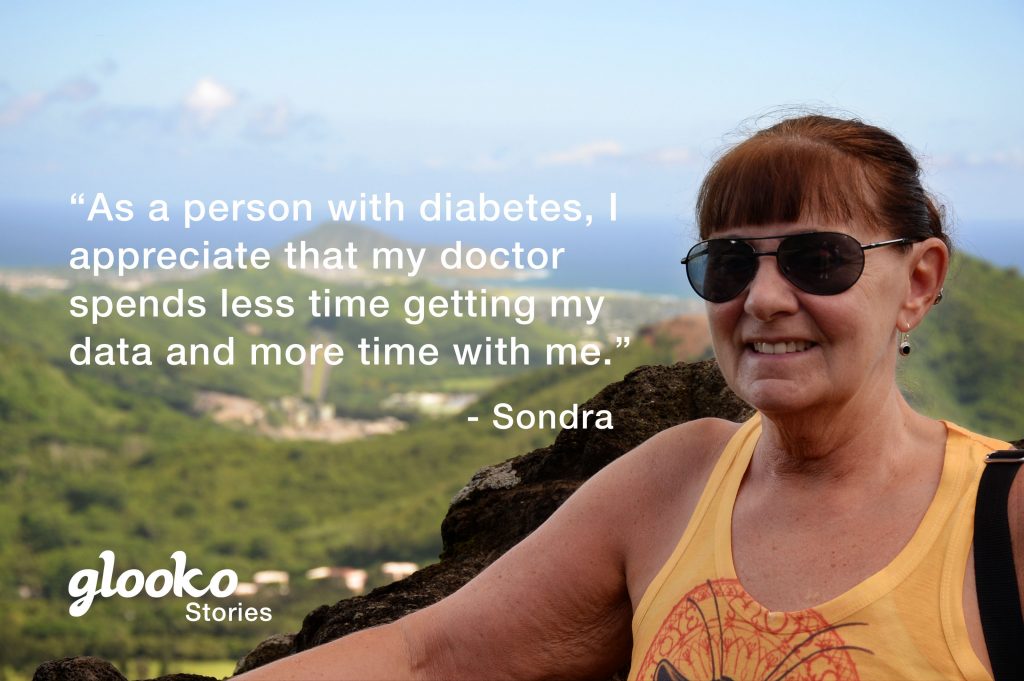
Sondra Uses Glooko to Share Her Diabetes Data with Her Care Team
Tell us about yourself.
I was diagnosed at age 57 originally with Type 2 diabetes. Before my diagnosis, I was experiencing massive cravings for soda, fuzzy vision and weight loss. When I went in to see my doctor, my blood glucose level was 568 mg/dL. I was immediately started on Metformin. The following week when I met with the CDE and nutritionist my blood sugar levels were very high again and my nurse was concerned – after contacting my doctor I was given an injection of insulin which brought the BG levels down in less than an hour. Ultimately, my care team discovered that I had Type 1, not Type 2 diabetes. Through self-management, I was able to reduce my A1c from 12.75% to 7.0% in only a couple of months.
What are some of your hobbies?
I’m an avid gardener – after retiring in 2015, I became a volunteer with the Washington State University Master Gardener program. I supervise the tomato project where we start over 2,500 tomato plants for our spring sale!
What is your favorite food?
Broccoli – it’s great right out of the garden and I have a delicious broccoli salad recipe that I make all summer.
How did you hear about Glooko?
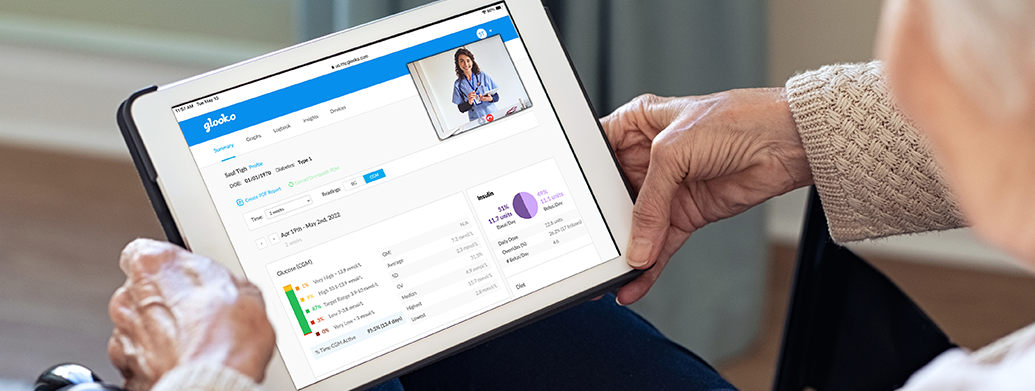
I actually heard about Glooko through my endocrinologist! She was originally at CHI Franciscan in Washington, but left recently to pursue her own private practice and I followed her there. In the clinic, she told me about the Glooko app and explained to me how I could view my Omnipod® System and Dexcom® data together. As a patient, I appreciate that my doctor spends less time getting my data and more time with me, discussing ways to improve my diabetes management.
Why Glooko?
I use both an Omnipod® System and Dexcom® and I love that the Daily Overview graph allows me to see my blood sugar and insulin data from those devices all in one place. I can actually see how my insulin impacts my blood sugar levels. Prior to Glooko, I would look at my blood sugar data on my meter, but finger stick data alone did not allow me to see the big picture. With Glooko, I’m able to see my trends and really evaluate how well I’m doing with my diabetes care routine. Because I’m able to see my day at a glance, it’s helped me to stay in better control.
Do you share your diabetes data?
Yes! It’s made a huge impact because it allows my doctor to have access to my data before my appointment. Instead of her having to master 20 different diabetes management software programs, she really only has to use Glooko. Not only does this decrease the time she spends downloading my data while I’m there in clinic, but it also means that she doesn’t have to relearn where to look in a report to identify my trends or fluctuations. It has made my appointments with her a lot more productive.
What’s the best thing you have learned or advice that you want to share for navigating through diabetes?
By making my own body a “science project,” I use the charts and graphs on Glooko to see how my food choices and insulin doses are impacting my ability to reach my goals. Also, I try to never regret having food that might make my BG jump – I’ll do better next time.
Jessica’s Journey to Glooko and the World of Diabetes Data Management
Life is funny. If you had asked me 10 years ago where I would be in life, I would not have guessed that I’d be working for a startup company that is the leader of the diabetes management space. My journey to Glooko has been one of many paths, all driven by the desire to help people. After taking a psychology class in college, I was hooked on the human services field. Back then, like many young adults, I graduated college unsure what to do next.
In search of my path, I joined the Peace Corps and was sent to a rural town in Ecuador, South America, to work in youth and family development. There, living in isolation and with limited resources, I learned “how to learn” so that I could accomplish my personal goals and the goals of my community. This involved a lot of trial and error, research, and YouTube videos (I now consider myself a proficient balloon animal artist!). Though I didn’t fully recognize it at the time, those 2.5 years I spent overseas offered me the greatest possible early career development experience. I developed resourcefulness, adaptability, unmeasurable strength, and creative innovation which continue to serve me today.
Fast forward about 5 years. After working in various case management and program management positions, I was introduced to Glooko by a close friend and was immediately drawn to Glooko by the fast-paced startup culture and choose-your-own-adventure feel. Glooko offered a sense of excitement that I hadn’t experienced since hopping on the plane to Ecuador.
I quickly discovered that one of the most exciting things about working for a growing startup like Glooko is the opportunity to grow with the company.
After my Glooko onboarding, I began primarily doing direct customer support – working with people with diabetes, their loved ones, and their respective care teams to support them in their use of the Glooko platform. In order to build my knowledge and skillset, I filled spare time with other interesting projects at Glooko. This not only introduced me to others within the company, but also helped me hone my skills and expand my knowledge base. Over the last 2 years at Glooko, my role has evolved several times, from customer success to partnership management, however, my underlying goal and passion remains with helping people.
As Glooko has grown, I have been lucky to gather a variety of experiences and a plethora of knowledge about Glooko, our vision, and the fast-paced diabetes space. I see the hope for the future of diabetes management, made possible by innovation and strategic partnerships with health systems, employers, health plans, device manufacturers, and leading life science companies worldwide. I also see how a small team can make a huge difference in the lives of millions of people. As I focus on the future, I look forward to playing my part in shaping the future of diabetes management, and more importantly, seeing how much the industry will accomplish through partnerships and innovation.
National Blood Donor Month
January is National Blood Donor Month and while not everyone with diabetes may be eligible to donate their blood, it got us thinking of just how MUCH blood people with diabetes give to their diabetes care.
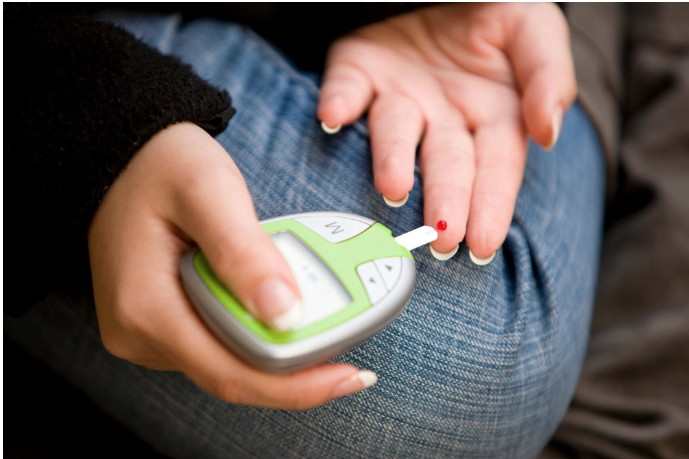
According to a quick search, the human body contains 120,000 (!!) drops of blood. Depending on your type of diabetes and your individual treatment plan, your doctor may recommend anywhere from 2-10 blood glucose (BG) checks per day. We know that everyone is different and the number of BG checks will vary person to person.
The simple fact is, no matter how many times you are checking your BG, you are actively giving your blood to your diabetes care. So how much have you given?
Let’s do the math!
To keep it simple, we are going to assume that each BG check generates 2 drops of blood. That means you can multiply 2 by the number of BG checks per day/week/month/year and get a pretty good idea of how much blood you’ve given. Don’t want to do the math yourself? That’s ok, we broke it down for you below! Simply find your number of BG checks per day and take a look at your results. If you use Glooko, you can easily find your average readings per day by going to my.glooko.com and checking out the Summary page.
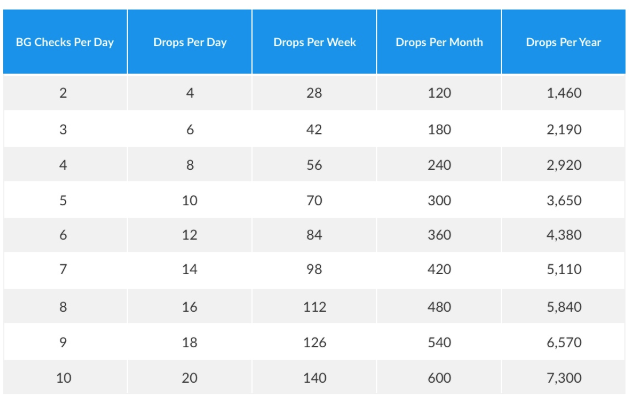
It really adds up! And since this is for 2 drops per BG check, we know these numbers may still be on the low side.
Let’s go one step further: take the number of drops per year and multiply that by the number of years since your diagnosis. This number represents just how much blood you have given to your diabetes care. Scott Bissinger from our Marketing team calculated that he has given approximately 46,720 drops of blood to his diabetes care since his diagnosis 8 years ago. That’s almost half of all the blood in the human body!
We salute all PWDs and the blood you have given for your diabetes management. Share your number with us on Twitter using #DropsForDiabetes and tagging us @GlookoInc!
Living with diabetes during the COVID-19 pandemic: A real-world look at how people with diabetes have been impacted
Glooko users show a slight trend toward better glucose control during the pandemic.
People with diabetes face a greater chance of experiencing serious complications caused by the coronavirus. To understand the impact of COVID-19 on people with diabetes, we analyzed glucose, insulin, and activity trends from users of Glooko solutions in the United States. We have measured data before and after mid-March, when the COVID-19 pandemic was declared as a national emergency and most state-level shelter-in-place orders came into effect.
Our main takeaways from the data analysis are that after shelter-in-place started, weekends and weekdays blend together when it comes to blood glucose levels. We also see a slight trend toward better glucose control and slightly lower and more consistent carb intake. There is however no change in insulin amounts.
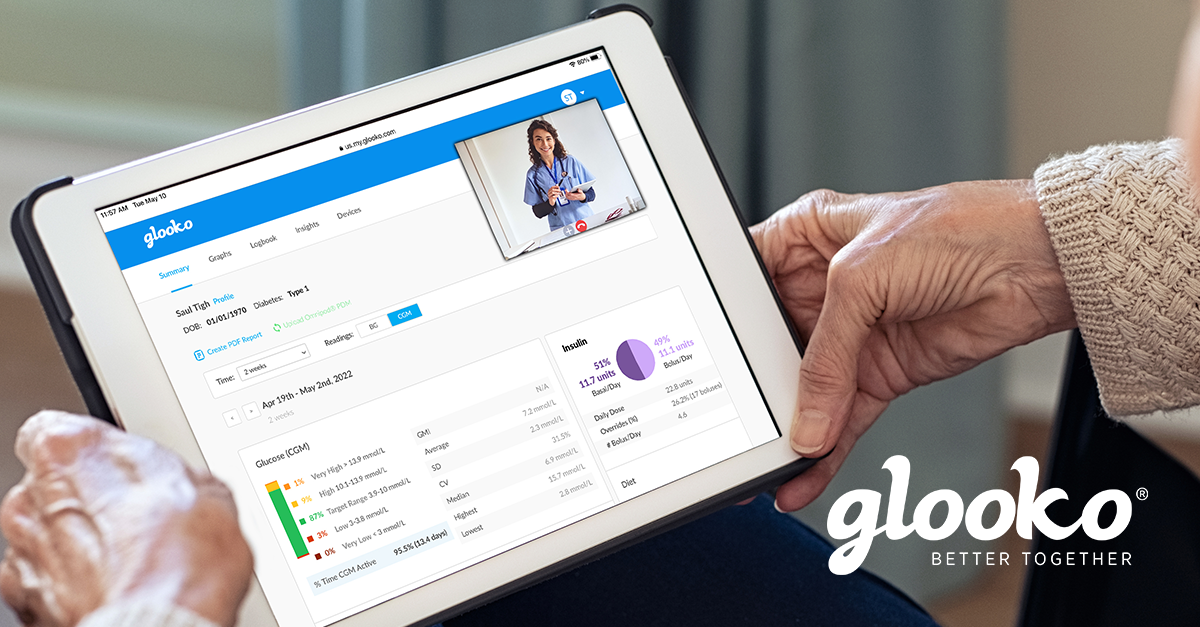
To support people with diabetes and healthcare providers during the pandemic, we are offering a secure, privacy-protected remote-care solution at no charge to enable safe, connected patient care. This solution allows individuals to access ongoing medical care with their healthcare providers by facilitating remote appointments. People with diabetes are also able to track their glucose, insulin, and lifestyle data such as food and activity right in the Glooko Mobile app.
KEY TAKEAWAYS
Weekends and weekdays blend together
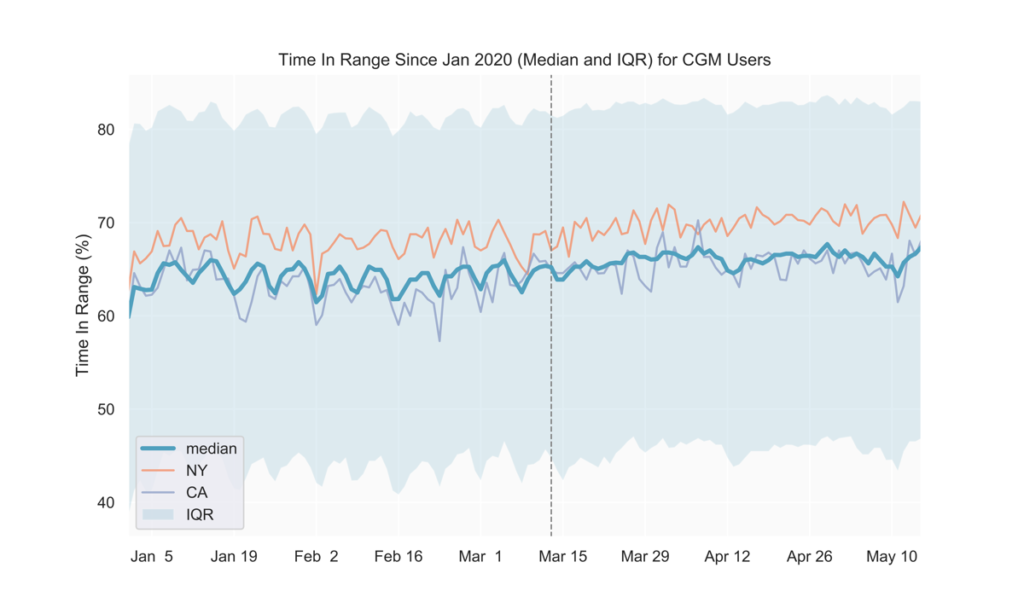
Prior to COVID-19-related shelter-in-place orders across the United States (around mid-March), we observed a weekly pattern consisting of relatively higher average blood glucose on the weekends, with the peak happening on Sundays. Similarly, time in range (TIR) for CGM users tended to be highest during the week and lowest on Sundays. Starting in early to mid-March, average glucose values decreased and the daily fluctuations over the week became less pronounced (Fig. 1, 2). Average glucose and TIR on weekends eventually resembled weekday levels pre-COVID-19 (Fig. 1, 2, 3).
The data show that since the national shelter-in-place order was implemented in the US in mid-March, the day-to-day fluctuations in glycemia that previously showed a weekly pattern began to dissolve, presumably as the day-to-day lifestyle and behavior on weekdays and weekends became increasingly similar.
Note: the slight peak in average glucose on April 12-13 corresponds to Easter Sunday and Monday.
Fig 1.
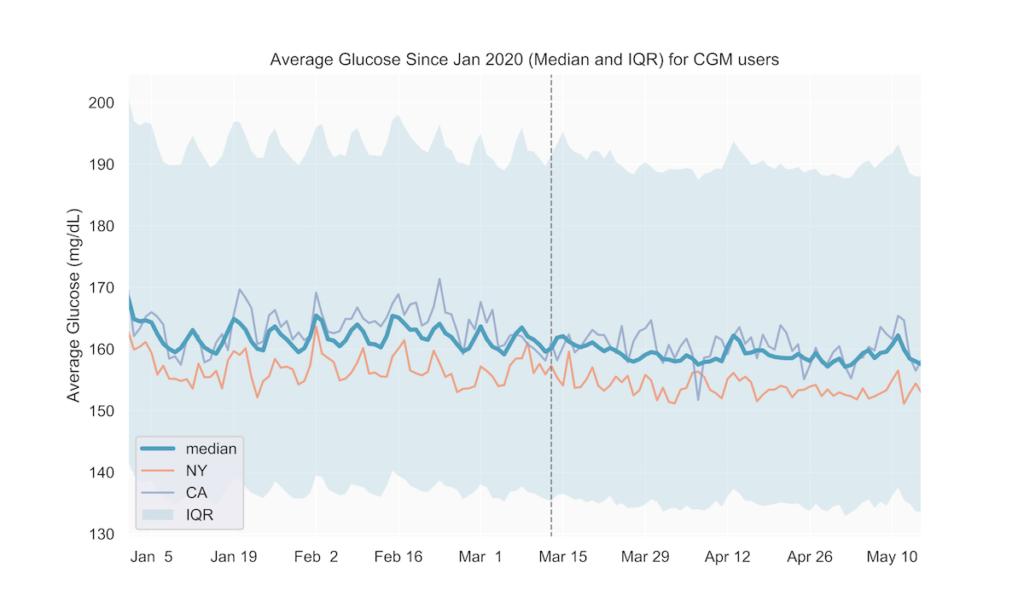
Fig 2.
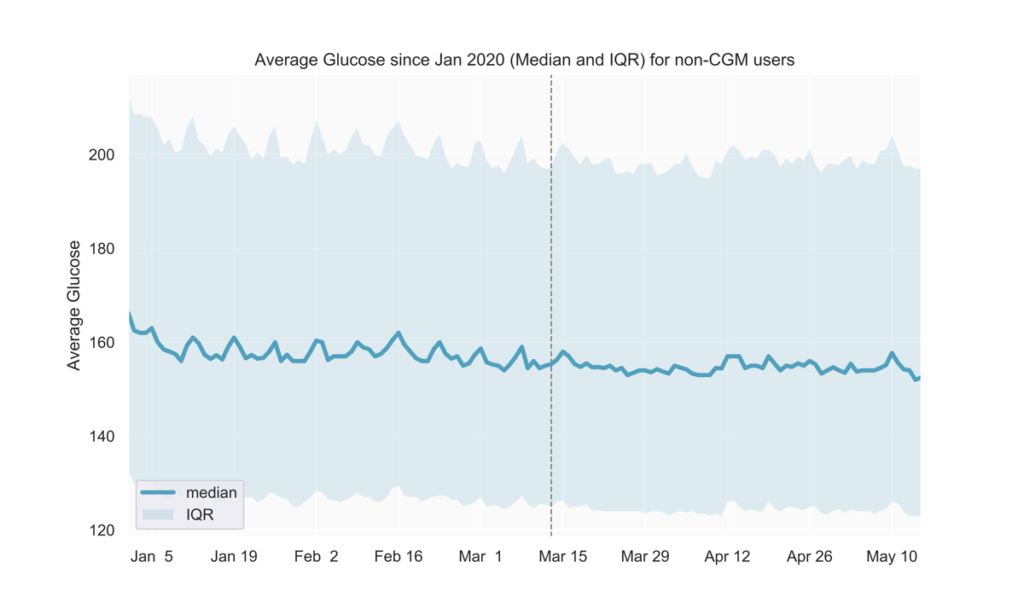
Fig 3.
Slight trend toward better glucose control
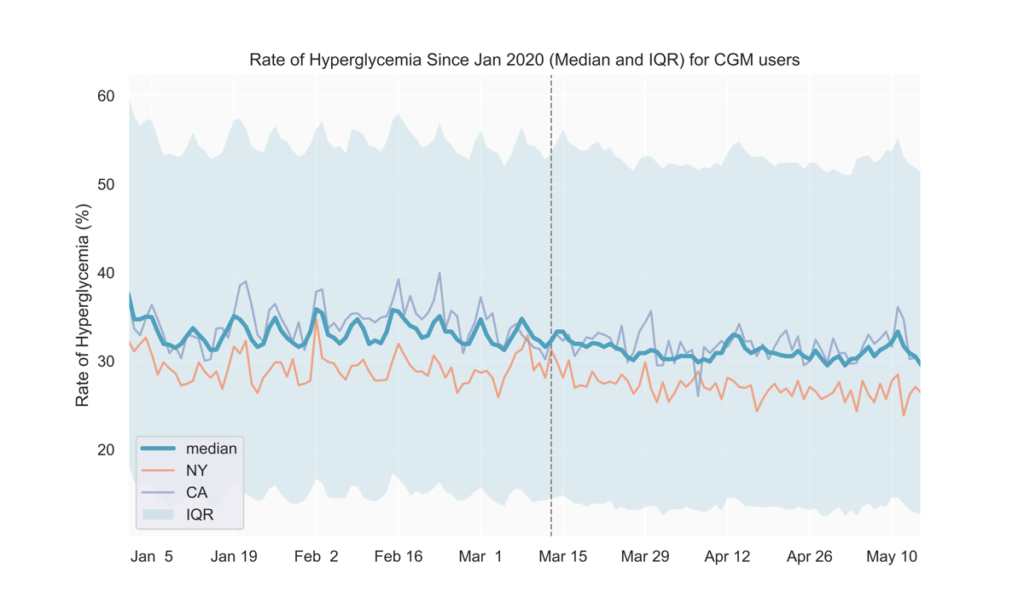
After mid-March, we observed lower average blood glucose levels and hyperglycemia rates, along with slightly higher TIR (Fig. 1-4). These could possibly result from staying at home leading to people with diabetes having more time for diabetes management.
Fig 4.
See the tables below for comparisons of glucose outcomes before and after March 13 (when the Federal emergency was announced). The differences in TIR, average glucose, and rate of hyperglycemia were statistically significant (p<0.0001).
| CGM users | Pre March 13 (3-week period) |
Post March 13 (3-week period) |
| TIR mean (IQR) | 62.3% (49.3, 76.5) | 63.3% (49.8, 78.2) |
| Average Glucose mean (IQR) | 166.4 mg/dL (142.8, 186.4) | 164.6 mg/dL (140.2, 185.3) |
| Rate of Hyperglycemia mean (IQR) | 35.3% (19.8, 49.3) | 34.3% (18.1, 48.6) |
| Non-CGM users | Pre March 13 (3-week period) | Post March 13 (3-week period) |
| Average Glucose mean (IQR) | 169.2 mg/dL (132.1, 195.4) | 167.5 mg/dL (129.5, 194.1) |
States with early adoption of shelter-in-place directives align with national trends
We also analyzed the above metrics at the state level to find out if shelter-in-place impacts on lifestyle and glycemic management in individual states affect our users’ glucose differently than the national average. As seen in Fig. 1 and 3, states adopting shelter-in-place relatively earlier (e.g., NY, CA) do not seem to show deviations from the national trends thus far. We will continue to track individual states as they gradually reopen to detect if any new trends emerge in the next few weeks.
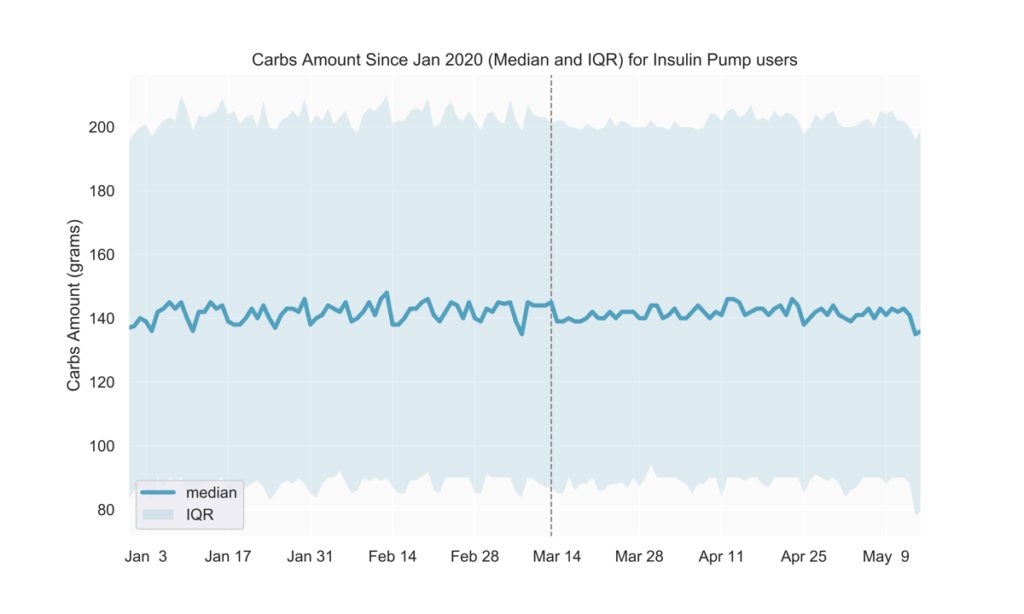
Slightly more consistent carb intake
Pre-COVID-19, carb intake was generally lower during the week and higher on weekends. Among people with diabetes who are insulin pump users, we observed less pronounced daily fluctuations over the week following mid-March (Fig. 5).
Fig 5.
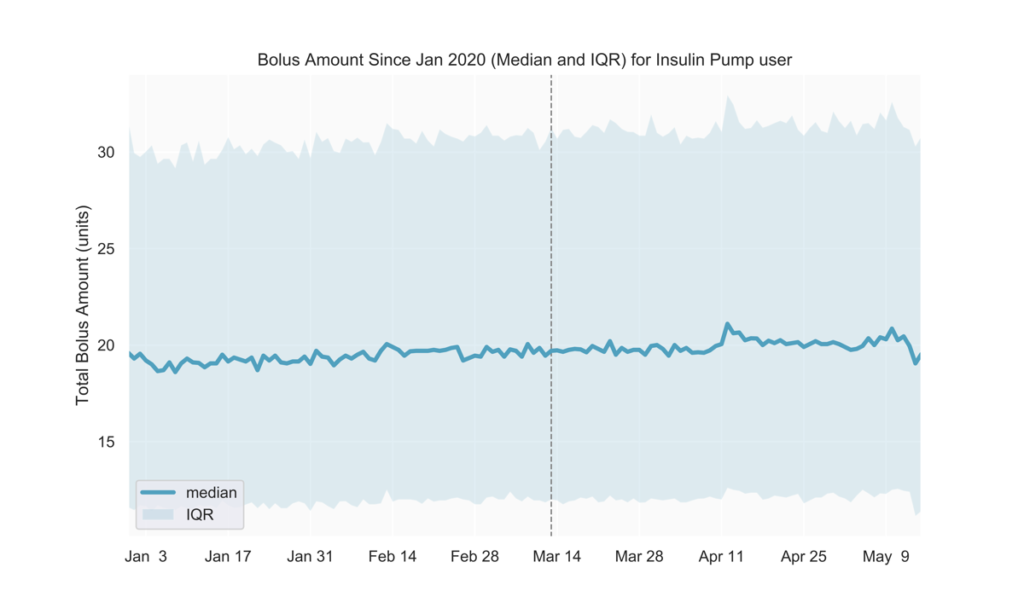
No change in insulin amounts
We observed no discernible changes in the total amount of daily bolus insulin dose among insulin pump users. We will continue to track insulin use to understand if possible disruptions in obtaining prescription drugs will reflect in users’ daily diabetes management. (Fig 6)
Fig 6.
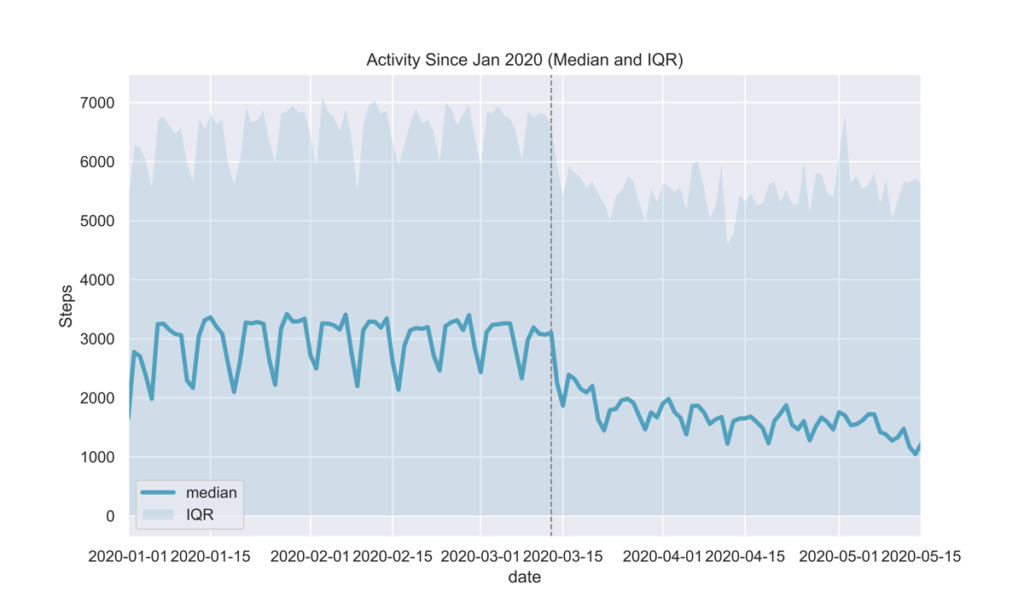
Decreased activity
Glooko users are able to easily track their activity and how it affects their glucose by connecting their preferred activity trackers and apps to the Glooko Mobile app. By analyzing daily steps, we observed a drop in activity post-March 13 as seen in Fig. 7. This was an expected outcome given national shelter-in-place orders in the USA.
Fig 7.
METHOD DATASET
Glucose, insulin, and activity data were sampled from in-clinic and at-home Glooko users in the USA between January and April 2020, and analyzed separately for two main cohorts:
- CGM users: People with diabetes who use a continuous glucose monitoring device,
- non-CGM users: People with diabetes who rely on glucose meters and/or insulin pumps for their diabetes management.
INCLUSION CRITERIA
This analysis included CGM users who had at least 144 CGM readings on any given day, and non-CGM users who had at least 1 glucose reading on any given day.
DEFINITIONS
- Average glucose
- non-CGM users: the average value of glucose readings on a given day in mg/dL
- CGM users: average estimated glucose value on a given day in mg/dL
- Time In Range (TIR), reported only for CGM users: the percentage of estimated glucose values between 70-180mg/dL on a given day
- Rate of Hyperglycemia reported only for CGM users: the number of readings above 180mg/dL on a given day
- Total Bolus Amount reported only for insulin pump users: the total units of insulin (normal and extended) on a given day
- Carbs Amount reported only for insulin pump users: the total amount of carbs that were entered into the insulin pump on a given day
MKT-0213 01
How to scale telehealth programs by leveraging diabetes data to identify “at-risk” patients
The expansion in reimbursement coverage for both telehealth and remote patient monitoring (RPM) services offers unique opportunities for delivering enhanced care for patients with diabetes, and many healthcare organizations are seeking to take advantage.
For those organizations that are either starting or scaling virtual patient care programs, a common and recurring step in the workflow is identifying which patients are “at-risk” and could benefit from more care. By doing so, health systems are able to deliver targeted and proactive care to those patients, which can result in improved long term patient outcomes and cost-savings. Prior to the expansions in reimbursement coverage, delivering proactive, virtual care was a service few health systems could afford because of the strict constraints on what kinds of virtual appointments were reimbursable.
Three common challenges in identifying at-risk patients
The process of “identifying at-risk” patients must be implemented through a collaboration between an organization’s clinical & IT teams, that together define what it means for a patient to be “at-risk” using data stored in the EHR. While this workflow is understood in theory, three common challenges associated with operationalizing this workflow are equally understood:
- the EHR data used for risk-triaging is often inconsistent or incomplete (Botsis et al., 2010)
- defining what it means to be “at-risk” varies by demographic and there can be many “risk cohorts”
- there is often insufficient IT/analyst capacity to address the data-intensive work posed by challenges 1 & 2.
These opportunities and challenges are amplified within diabetes care. “Beyond A1c” glucose & insulin metrics derived from diabetes self-management devices can be used to risk stratify diabetes populations with accuracy and latency not achievable when leveraging standard diabetes-related EHR data (e.g. A1c values, singular fasting glucose values). But because “diabetes device” data interoperability has only recently become portable, most healthcare organizations are not yet equipped to store diabetes device data with high granularity within their EHR and thus currently can’t use these data.
Glooko’s solution
To assist our users, Glooko has developed a comprehensive digital health platform for diabetes that includes the “at-risk” feature which allows healthcare organizations to risk-triage their diabetes population.
Using Risk-Triaging & Cohorting to Support RPM & Telehealth
1. Prevent Emergency Room visits by identifying patients experiencing hypoglycemia
Hypoglycemia can be dangerous for people with diabetes and hypoglycemia-related ER hospitalizations are expensive for healthcare organizations (Bronstone & Graham, 2016). Hypoglycemia is especially prevalent within Type 1 diabetes adolescent populations, for whom the combination of rapid physical development and hectic schedules can result in highly variable glucose levels (Borus & Laffell, 2010; Datye et al., 2015).
With the recent changes to telehealth reimbursement policy, health systems can use Glooko’s solution to identify patients at risk for severe hypoglycemia at the cadence that they choose (e.g. every 7 days. 30 days, etc.), and subsequently schedule a newly reimbursable virtual visit, resulting in timely patient care while mitigating the patient’s (and payer’s) risk of incurring a costly hypoglycemia-related ER visit.
To easily identify this patient cohort, you can use Glooko’s Age, Time CGM Active and Hypoglycemia filters.
2. Find patient candidates eligible for Remote Patient Monitoring
To run a viable RPM program, health systems must rigorously evaluate which patients are “at risk” and likely to benefit from additional care and which patients generate an adequate amount of qualified data (a minimum of 16 days worth of remotely transmitted data every 30 days is required for certain RPM reimbursement codes).
Using the Cohort feature, you can easily identify patients that meet both criteria. For example, an ideal RPM cohort might be patients that have an Average BG over 250 mg/dL over the last 30 days (cohort may benefit from RPM care) that also check their blood sugar more than 1 time per day (cohort meets the data threshold for reimbursement).

3. Manage hyperglycemia for patients enrolled in the RPM program
Once patients are enrolled in an RPM program, the Cohort feature allows for easy identification of patients experiencing conditions such as hyperglycemia among patients 65 or older with Type 2 diabetes. Upon identification, clinicians can intervene to manage hyperglycemia through a combination of lifestyle coaching (diet & exercise) and/or medication adjustments.
Once a cohort has been found, Glooko offers various methods for identifying each patient that is included in that cohort and taking the appropriate actions for those patients. Stay tuned for Glooko’s next blog to learn more!
References
- Borus JS, Laffel L. Adherence challenges in the management of type 1 diabetes in adolescents: prevention and intervention. Curr Opin Pediatr. 2010;22(4):405-411. doi:10.1097/MOP.0b013e32833a46a7
- Botsis T, Hartvigsen G, Chen F, Weng C. Secondary Use of EHR: Data Quality Issues and Informatics Opportunities. Summit Transl Bioinform. 2010;2010:1-5. Published 2010 Mar 1.
- Bronstone A, Graham C. The Potential Cost Implications of Averting Severe Hypoglycemic Events Requiring Hospitalization in High-Risk Adults With Type 1 Diabetes Using Real-Time Continuous Glucose Monitoring. J Diabetes Sci Technol. 2016;10(4):905-913. Published 2016 Jun 28. doi:10.1177/1932296816633233
- Datye KA, Moore DJ, Russell WE, Jaser SS. A review of adolescent adherence in type 1 diabetes and the untapped potential of diabetes providers to improve outcomes. Curr Diab Rep. 2015;15(8):51. doi:10.1007/s11892-015-0621-6
MKT-0112 01
Supporting remote patient monitoring (RPM) by leveraging machine learning to predict dropout risk
Glooko’s solution to help healthcare systems implement smoother RPM workflows
As Remote Patient Monitoring (RPM) services experience higher adoption especially with the expansion of reimbursement for such programs, opportunities to support proactive care in the diabetes space emerge.
Glooko provides care teams with the ability to remotely monitor and provide diabetes management services for people with diabetes without needing to visit the clinic. The goal is to broaden access to remote diabetes management and ensure continuity of care between patients and healthcare professionals and deliver a personalized, uncomplicated experience for people with diabetes.
As health systems implement RPM programs, a few common challenges arise:
- Some patients disengage with the digital health technologies that are required to run RPM programs, with the patient’s dropout risk being greatest during the first three months after onboarding to the program.
- For patients that disengage with digital health tools, care providers are unable to provide effective monitoring and coaching because they have insufficient data on their remotely monitored patients.
- Reimbursement for RPM services requires enough patient data to meet thresholds for CPT codes, and reimbursement is at risk for patients that disengage with their digital health tools.
Requirements for frequency and amount of patient data to meet RPM reimbursement criteria highlight the need for continued patient engagement. Therefore, understanding and targeting patient “dropout risk” (the likelihood of the patient dropping out of the RPM program) is essential for health systems to effectively run remote patient monitoring workflows.
Leveraging dropout risk to take timely action
To help health systems with the above challenges and support timely targeting of interventions in RPM programs, Glooko predicts patient dropout risk (the likelihood that the patient will drop out) up to 4 weeks prior to patient disengagement from the program. The feature gives health systems the opportunity to identify and selectively reach out to patients at highest risk of dropout in a timely manner, resulting in a smoother RPM experience that meets reimbursement criteria.
We offer the Dropout Risk insight through the „At-Risk“ feature that is part of Glooko’s digital health platform for diabetes (Figure 1). A higher risk score for a patient corresponds to a greater probability of dropping out over the next 4 weeks. From there, health systems are able to easily identify patients at high risk of program dropout and intervene proactively.
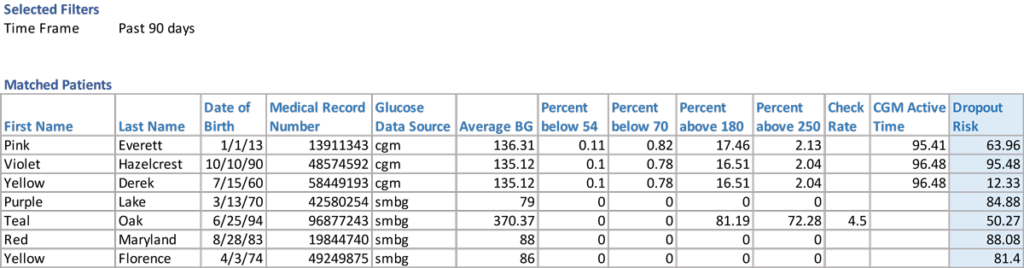
Figure 1. Predicted dropout risk scores offered through Glooko’s “At-Risk” feature.
Developing a machine learning model that predicts dropout risk
Glooko’s Dropout Risk feature predicts the probability that a patient will drop out in the next 4 weeks and updated predictions are available on a weekly basis. Dropout is defined as a patient who stops uploading their diabetes device(s).
We trained a machine learning (ML) algorithm that predicts, based on data from the 4 weeks prior to prediction, the probability that the user will drop out in the 4 weeks post prediction.
Building features and feature selection
To train our model, we used historical data over a 6-month period. We initially included 104 features (characteristics about the user) from three sources of data that consisted of demographics, diabetes outcomes, and mobile app engagement from the 4 weeks prior to prediction:
- Demographics information (e.g. type of diabetes, age) collected during user registration
- Diabetes outcomes (e.g. average glucose, hypo/hyperglycemia counts, reading frequency) derived from diabetes device data uploaded to Glooko
- Mobile app engagement data (e.g. app clicks)
We used feature selection to reduce the complexity of the model, make it more interpretable, and increase performance. To this end, we conducted Variance Inflation Factor (VIF) analysis to remove multicollinearity (i.e., features that were highly correlated with others). This resulted in a subset of 19 features that we used to train the machine learning model (Table 1).
Table 1.
Data features used to train the machine learning model
| DIABETES OUTCOMES AND ENGAGEMENT |
APP ENGAGEMENT | DEMOGRAPHICS |
| Hypoglycemia occurrences Hyperglycemia occurrences Average blood glucose Number of Glucose Checks |
Number of app clicks App features that were clicked Number of diabetes device uploads Days since last app activity Days since last device upload Number of active days on app |
Diabetes type Gender Age Tenure on Glooko Diabetes device type |
Model selection, interpretability, and feature directionality
While identifying patients of highest dropout risk is important (who is dropping out?), an interpretable machine learning model (whyare they dropping out?) is equally important to be able to understand and target patient dropout.
Leveraging our trained Gradient Boosting Algorithm, which performed better than six other ML models, we derived feature importance scores to find the strongest predictors of dropout, i.e., which patient characteristics highly affected dropout risk. The number of device uploads, the number of days since last device upload, and the number of glucose checks during the 4 weeks prior were the 3 features that influenced dropout risk the most (Figure 2).
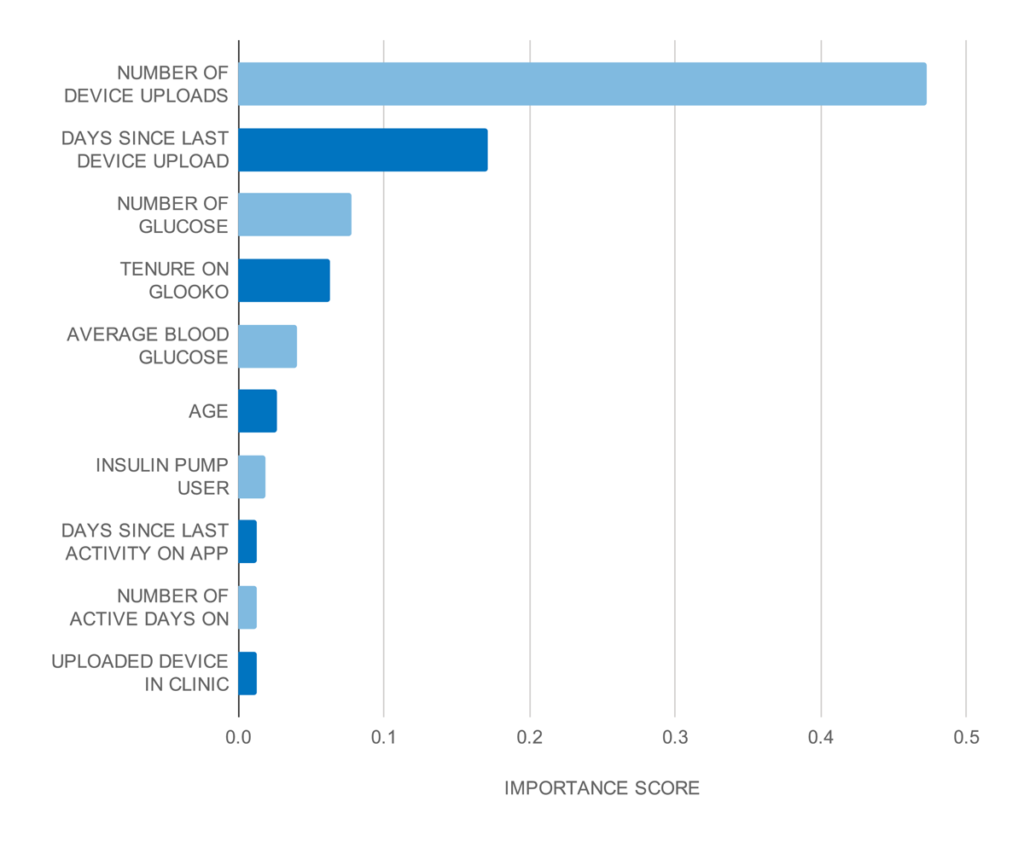
Figure 2.
Top 10 strongest predictors based on the gradient boosting classifier feature importance scores.
To find out the directionality of features, i.e., if a feature increases or decreases dropout risk, we trained a logistic regression model on the same dataset and derived feature coefficients.
Our analysis showed that a higher number of days since the last device upload increased dropout risk, while a higher number of device uploads and higher number of glucose checks both decreased dropout risk.
Model performance and validation
We performed out-of-sample validation, i.e., using data that was excluded from model training, to find algorithm performance metrics which are summarized in Table 2.
Model recall (sensitivity) was 81%, which means that the trained model correctly detected 81% of users that actually dropped out. With a precision of 68%, our model performed 1.35 times better than a baseline model that randomly predicts that a user will drop out.
Table 2.
Algorithm performance metrics on the test cohort
| PRECISION (Positive Predictive Value) |
RECALL (Sensitivity) |
SPECIFICITY | AUC |
| 0.68 | 0.81 | 0.59 | 0.78 |
We validated the model at different dropout risk levels and compared with the actual dropout rate for each level. Our risk predictions showed strong agreement with actual dropout rates. The figure below shows these comparisons at very low (0-20%), low (20-40%), medium (40-60%), high (60-80%), and very high (80-100%) risk levels.
For example, for users predicted to have very high dropout risk (80-100%), we found that the actual dropout rate for this cohort was 92.3%. Similarly, the actual dropout rate for those predicted to be at low risk (20-40%) was 27.6%.
| PREDICTED DROPOUT RISK |
ACTUAL DROPOUT RATE IN BIN |
| 0-20% (very low) | 8.00% |
| 20-40% (low) | 27.60% |
| 40-60% (medium) | 49.50% |
| 60-80% (high) | 71.00% |
| 80-100% (very high) | 92.30% |

Table 3 and Figure 3.
Model validation at different dropout risk levels.
References
Babikian S, Singh V, Clements MA. A Machine Learning Model Predicts Engagement with a Mobile Health (mHealth)-Based Remote Patient Monitoring (RPM) Program among Persons with Diabetes (PWDs). Diabetes 2020 Jun; 69(Supplement 1). https://doi.org/10.2337/db20-862-P
Declining diabetes outcomes after patient disengagement from Glooko®
People with diabetes who use the Glooko® app receive insights about their diabetes and easily share their diabetes data with their care teams. Within the clinic setting, the Glooko® Population Tracker allows the clinician to upload and view diabetes device data during appointments.
Glooko’s diabetes digital health solution with EHR integration enables care teams to streamline their diabetes care workflow and remotely monitor their patient population. Digital health companies collecting real-world health data (RWD) tend to focus on whether or not their users‘ health outcomes improve while engaging with their applications. However, most cannot measure what happens after users stop using their application („drop out“) because they do not have access to user data post-dropout.
This makes it difficult to understand if health outcomes decline, stay stable or improve after users stop using the application. This insight is valuable when analyzing the efficacy of a digital health application but is largely unavailable. If user outcomes generally deteriorate post-dropout, it suggests that the digital health solution plays a meaningful role in improving and sustaining outcomes. Conversely, if user outcomes continue to improve post-dropout, it could suggest that the digital health solution in and of itself may not be a critical driver of improved outcomes to begin with.
Glooko’s use within the in-clinic diabetes appointment workflow gives Glooko the unique ability to measure how health outcomes change for patients who drop out from using Glooko at home for diabetes self-management but keep their accounts active for use during their in-clinic appointments. Figure 1 (below) demonstrates the patient’s journey.

Figure 1. A Glooko user’s journey prior to and post-dropout.
When patients first begin using Glooko for diabetes management, Glooko downloads all historical glucose data stored on diabetes devices (this data was recorded by the patient prior to their Glooko use). This historical data is then compared to data recorded by the patients while using Glooko, which allows Glooko to analyze correlations between the patients’ use of the Glooko application and their changes in health outcomes (Figure 1, Timeline part 1). This pre-dropout analysis approach is common across digital health companies.
Glooko is also able to do a post-dropout analysis (Figure 1, Timeline part 2). After dropout, Glooko no longer collects patients’ diabetes data. However, most patients who stop using Glooko at home will typically continue to perform self-management and eventually visit their clinic for routine diabetes appointments. When clinicians upload those patients’ devices via Glooko’s in-clinic solution, Glooko obtains retrospective diabetes data for the time period between when the patients dropped out and their clinic appointments. This allows us to perform analyses on the second part of the timeline (shown on Figure 1: Current Analysis: What happens to diabetes outcomes after patients stop using Glooko remotely?).
Analysis & Results Summary
Across the 472 users analyzed we found that, on average, users who drop out (stop uploading data to Glooko and subsequently stop using Glooko) experience deteriorating diabetes outcomes. Compared to the two weeks prior to dropping out, at six to eight weeks post-dropout, we observed the following:
- An increase in average glucose by 5 mg/dL.
- An increase in percent of readings in hyperglycemia by 3%.
- A decrease in percent of readings in range by 1.7%.
- A 7.5% decrease in the number of daily glucose checks from an average of 4 to 3.7 readings.
The data suggests that patient dropout is correlated with future worsening diabetes outcomes. To prevent this, health systems implementing RPM programs can utilize Glooko’s ML-based Dropout Risk feature, which predicts, on a weekly basis, the risk that a patient will stop uploading their diabetes data to Glooko in the upcoming four weeks. Using this feature, health systems implementing RPM programs can identify which patients are at high risk of dropping out of the program and intervene ahead of time. This ensures continuity of care and smoother RPM program workflows while simultaneously preventing worsening outcomes.
Analysis & Results Deep Dive
In this analysis, we investigated self-monitoring glucose meter (SMBG) data from 472 Glooko users who met the following criteria:
- Used Glooko for at least six weeks by uploading their diabetes device data (SMBG and/or insulin pump devices) remotely; and
- Dropped out (stopped remotely uploading data to the Glooko platform after a minimum of six weeks of use while keeping their Glooko accounts for in-clinic appointments); and
- Had an in-clinic appointment after at least eight weeks post-dropout during which their data were uploaded to the Glooko platform.
We retrieved the patients’ glucose readings after dropping out to compare patients’ outcomes during the two weeks prior to and six to eight weeks post-dropout. Demographics are included in Table 1 (below).
|
Total N
|
Diabetes Type
|
Gender (for those who specified)
|
Age Median (IQR)
|
|
472
|
70% Type 1
11% Type 2
19% Other
|
53% Female
|
19 (13-47)
|
Table 1. Demographics of the cohort considered for analysis.
For each of the above metrics (average glucose, percent readings in hyperglycemia, percent readings in severe hypoglycemia, and daily reading count), we performed a paired student t-test comparing the two-week averages of the 472 patients during the two weeks prior to dropout to the two-week averages at six to eight weeks post-dropout. We deemed the hypothesis test significant (rejecting the null hypothesis that the two distributions are identical), if the resulting p-value was less than 0.05. I.e., we performed a statistical test to determine if there is a significant difference between the outcomes of this cohort prior to and post dropping out.

Average glucose increases after dropout
Average blood glucose (BG) values increased after dropping out. Patients experienced a steady increase in their average BG, reaching a plateau of approximately 193 mg/dL (value in mmol/L) at six to eight weeks post dropout, compared to 188 mg/dL (mmol/L) during the two weeks prior to dropout (Figure 2). This difference was statistically significant (p=0.004).
Figure 2. Average blood glucose (BG) in two-week increments across 472 patients prior to and post-dropout. The dropout week for all patients was aligned at 0 weeks (red dashed line), and week numbers are relative to the dropout week.
Percentage of readings in hyperglycemia and severe hyperglycemia increases after dropout, while the percentage of readings in-range decreases
The percentage of glucose readings that were in hyperglycemia (above 180 mg/dL) experienced a steady increase to reach an average of 47.5% at six to eight weeks post-dropout. Compared to the two weeks prior to dropout, this constitutes a 3% increase in hyperglycemia (Figure 3). This difference was statistically significant (p=0.02).
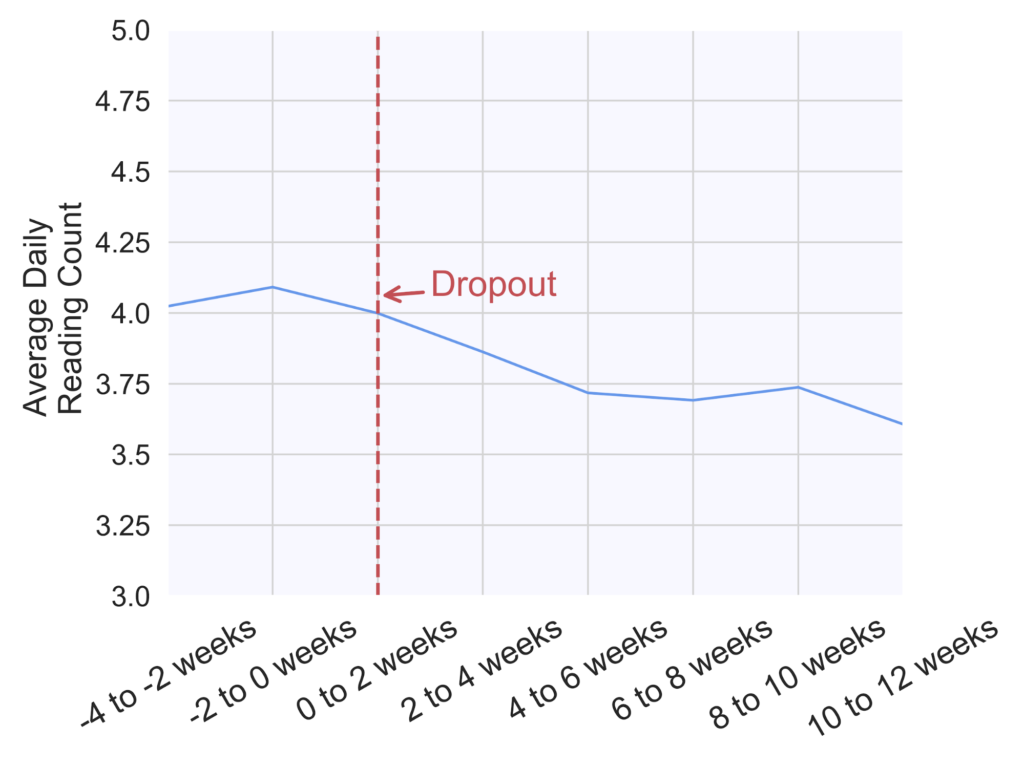
Figure 3. Percentage of readings in hyperglycemia (above 180 mg/dL) in two-week increments across 472 patients prior to and post-dropout. The dropout week for all patients was aligned at 0 weeks (red dashed line), and week numbers are relative to the dropout week.
Similarly, the percentage of readings in severe hyperglycemia (above 250 mg/dL) increased on average from 23.5% during the two weeks prior to dropout to 25% at six to eight weeks post-dropout (Figure 4). This difference was statistically significant (p=0.03).

Figure 4. Percentage of readings in severe hyperglycemia (above 250 mg/dL) in two-week increments across 472 patients prior to and post-dropout. The dropout week for all patients was aligned at 0 weeks (red dashed line), and week numbers are relative to the dropout week.
In parallel to an increase in hyperglycemia occurrence, we observed a decrease in the percentage of readings that were in the normal glucose range (70-180 mg/dL), as seen on Figure 5 (p=0.03).
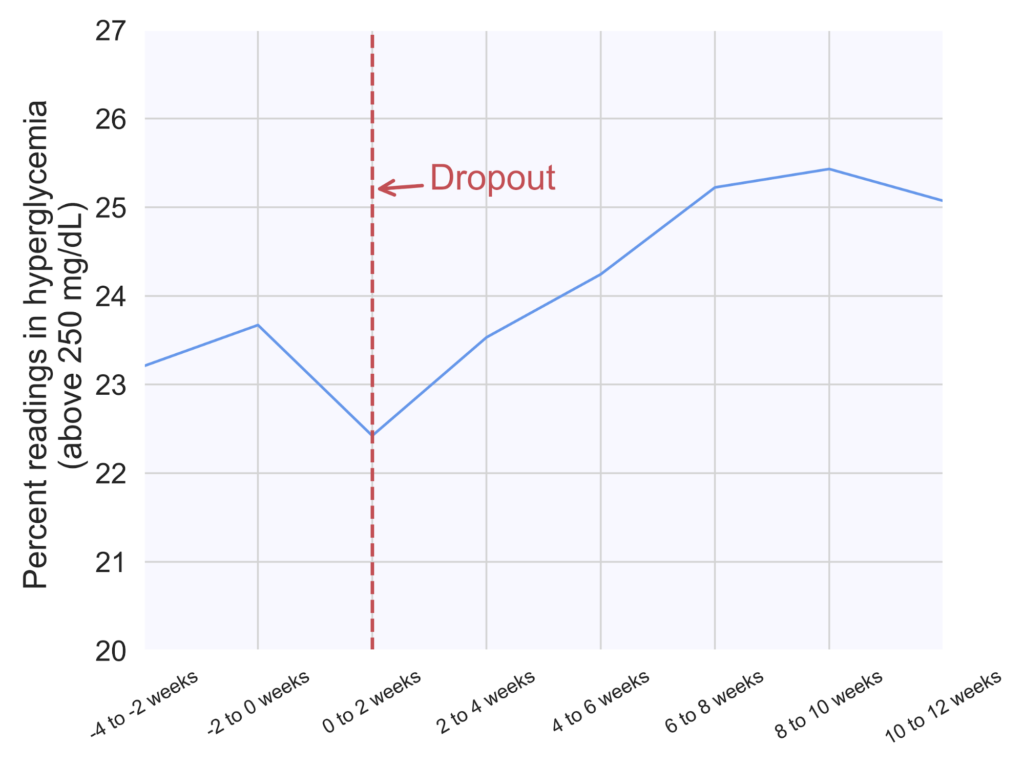
Figure 5. Percentage of readings in range (70-180 mg/dL) in two-week increments across 472 patients prior to and post-dropout. The dropout week for all patients was aligned at 0 weeks (red dashed line), and week numbers are relative to the dropout week.
The average number of daily glucose checks slightly decreases
Finally, the number of daily glucose checks experienced a 7.5% decrease from an average of four checks per day during the two weeks prior to dropout to 3.7 checks per day at six to eight weeks post-dropout (Figure 6). This difference was statistically significant (p<0.00001).
Figure 6. Average number of daily glucose checks in two-week increments across 472 patients prior to and post-dropout. The dropout week for all patients was aligned at 0 weeks (red dashed line), and week numbers are relative to the dropout week.
We did not find any discernible differences in the average percentage of readings in hypoglycemia.
MKT-0244 01
Abbott Precision Xceed Blood glucose meter
Use device manufacturer cable