
 The Glooko 2025 Global Diabetes Report offers a comprehensive look at how real-world data can drive better outcomes in diabetes care. Powered by billions of data points across 30+ countries, this report uncovers meaningful trends in glycemic management, technology adoption, and behaviors among people living with Type 1, Type 2, and gestational diabetes.
From the rise of remote monitoring to the impact of advanced technologies like Continuous Glucose Monitors (CGMs) and Automated Insulin Delivery (AID) systems, this report explores how personalized insights can be used to better inform personalized care, predict risk, and guide clinical decision-making.
Whether you’re a clinician, researcher, or innovator in diabetes management technology, this report highlights how data can be turned into action — helping to shape a smarter, more connected future of diabetes management.
At Glooko, we improve the health outcomes of people with diabetes and related chronic conditions through our personalized, intelligent, connected care platform. Our proven technologies make lives better by revolutionizing the connection between patients and healthcare providers, driving patient engagement and adherence via digital therapeutics, and accelerating the speed of clinical trials.
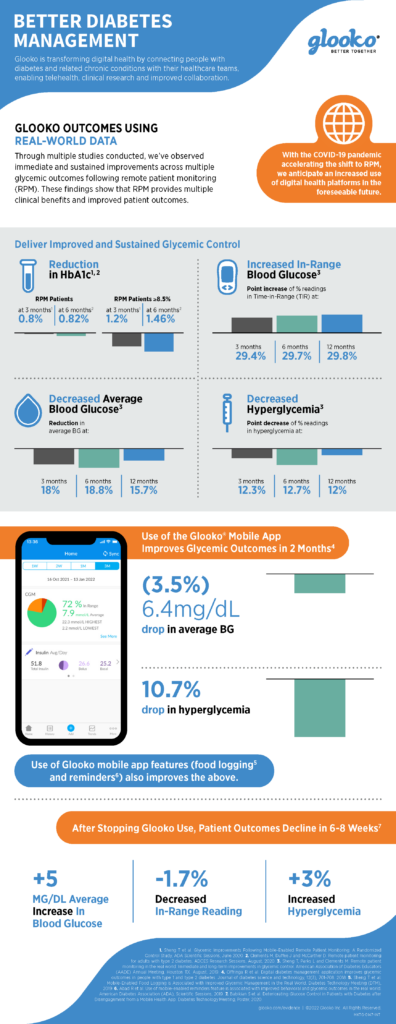
Through multiple clinical studies conducted, we’ve observed immediate and sustained improvements across multiple glycemic outcomes following remote patient monitoring (RPM). These findings show that RPM provides multiple clinical benefits and improved outcomes for people with diabetes.
Some of the highlights of our real-world data studies include:
-
Delivering Improved and Sustained Glycemic Control1,2,3
-
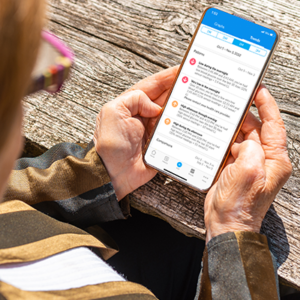
Use of the Glooko Mobile App Improving Glycemic Outcomes in 2 Months4
-
Declining Patient Outcomes 6-8 Weeks After Stopping Using Glooko5
Download the infographic (PDF) below for findings from our studies.
1. Sheng T et al. Glycemic Improvements Following Mobile-Enabled Remote Patient Monitoring: A Randomized Control Study, ADA Scientific Sessions, June 2020. 2. Clements M, Duffee J and McCarther D. Remote patient monitoring for adults with type 2 diabetes. ADCES Research Sessions, August, 2020. 3. Sheng T, Parks L and Clements M. Remote patient monitoring in the real world: Immediate and long-term improvements in glycemic control. American Association of Diabetes Educators (AADE) Annual Meeting, Houston TX. August, 2019. 4. Offringa R et al. Digital diabetes management application improves glycemic outcomes in people with type 1 and type 2 diabetes. Journal of diabetes science and technology, 12(3), 701-708. 2018. 5. Sheng T et al. Mobile-Enabled Food Logging is Associated with Improved Glycemic Management in the Real World. Diabetes Technology Meeting (DTM), 2019. 6. Abad R et al. Use of mobile-enabled reminders feature is associated with improved behavioral and glycemic outcomes in the real world. American Diabetes Association (ADA), Scientific Sessions, 2019. 7. Babikian S et al. Deteriorating Glucose Control in Patients with Diabetes after Disengagement from a Mobile Health App. Diabetes Technology Meeting, Poster, 2020.
MKT-0084 01
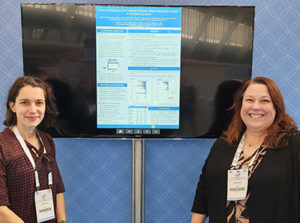 Glooko, a leading provider of intelligent, connected care solutions and remote patient monitoring (RPM) for people with diabetes and related chronic conditions, presented positive data from two recent studies on remote patient monitoring at the 2022 IDF World Diabetes Congress.
The first study presented by Team Glooko at the Congress, Cost and Outcomes of a Diabetes Remote Patient Monitoring System: A Simulation Analysis, was the company’s inaugural study using a health economics and outcomes research (HEOR) simulation model. In a randomized controlled trial of RPM and digital therapeutics (DTx), the intervention resulted in significantly improved HbA1c in patients with type 2 diabetes (T2D). Incorporating these results into a microsimulation model of longer-term complications, mortality and costs demonstrated the potential for RPM and DTx to elicit health gains and cost savings among people with diabetes.
The second study presented by Team Glooko, The Impact of Remote Patient Monitoring on Glycated Hemoglobin for Type 2 Diabetes: A Randomized Controlled Trial, demonstrated that a comprehensive 24-week RPM diabetes management program was more effective in improving HbA1c compared to usual care for adults with T2D.
These studies further showcase the clinical and economic benefits of the Glooko platform, which is sold to healthcare providers globally, and available for free as a mobile app to patients.
Team Glooko will continue to highlight the benefits of our connected care platform for diabetes and related chronic conditions at industry events in 2023.
MKT-0413 01
As befitting for the largest conference focused on diabetes care management, one of the hot topics at the American Diabetes Association (ADA)’s 82nd Scientific Sessions was about improving clinical workflows.
With the rise of telehealth and remote patient monitoring by healthcare providers due to the COVID-19 pandemic and work burnout afflicting providers and healthcare staff alike, there was a lot of discussion on how technology can help.
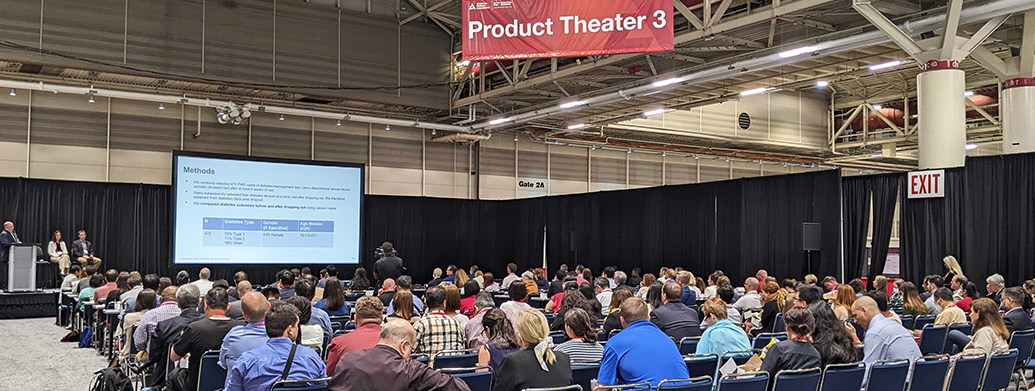
During Glooko’s Product Theater at the world premier event for diabetes, Carla Demeterco-Berggren, M.D., Ph.D., director of quality of the diabetes clinic at Rady Children’s Hospital in San Diego, shared how adopting the Glooko Enterprise solution led to a drastic improvement in their operational efficiencies. She discussed the time savings, increased satisfaction and how the flow of structured data into their EHR system supports ongoing research and quality improvement initiatives.
In addition, Glooko Chief Medical Officer Mark Clements, M.D., Ph.D. shared the latest clinical evidence demonstrating the improvement in clinical outcomes for patients with diabetes through our connected care company’s remote patient monitoring platform and mHealth app.
For those that missed it live, watch the presentation and discussion that followed it below.
This is not part of the 82nd Scientific Sessions as planned by the American Diabetes Association®. This content is neither sponsored nor endorsed by the American Diabetes Association®. This content does not qualify for continuing medical education (CME) credit.
MKT-0367 01
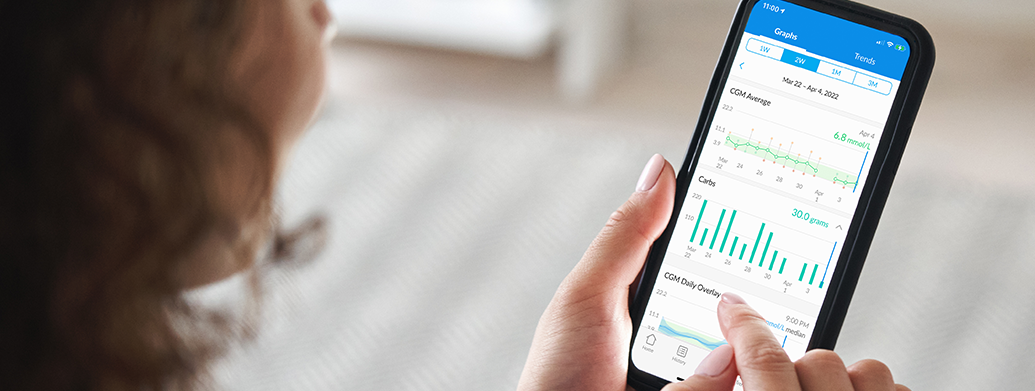
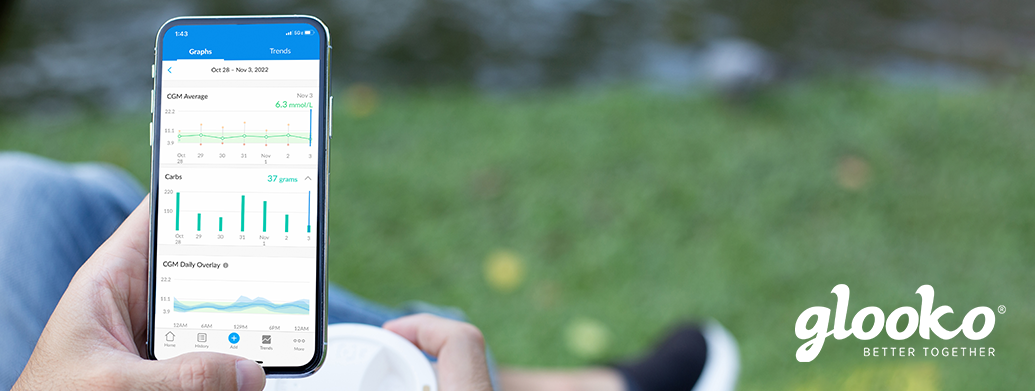
People with diabetes who use the Glooko® app receive insights about their diabetes and easily share their diabetes data with their care teams. Within the clinic setting, the Glooko® Population Tracker allows the clinician to upload and view diabetes device data during appointments.
Glooko’s diabetes digital health solution with EHR integration enables care teams to streamline their diabetes care workflow and remotely monitor their patient population. Digital health companies collecting real-world health data (RWD) tend to focus on whether or not their users‘ health outcomes improve while engaging with their applications. However, most cannot measure what happens after users stop using their application („drop out“) because they do not have access to user data post-dropout.
This makes it difficult to understand if health outcomes decline, stay stable or improve after users stop using the application. This insight is valuable when analyzing the efficacy of a digital health application but is largely unavailable. If user outcomes generally deteriorate post-dropout, it suggests that the digital health solution plays a meaningful role in improving and sustaining outcomes. Conversely, if user outcomes continue to improve post-dropout, it could suggest that the digital health solution in and of itself may not be a critical driver of improved outcomes to begin with.
Glooko’s use within the in-clinic diabetes appointment workflow gives Glooko the unique ability to measure how health outcomes change for patients who drop out from using Glooko at home for diabetes self-management but keep their accounts active for use during their in-clinic appointments. Figure 1 (below) demonstrates the patient’s journey.

Figure 1. A Glooko user’s journey prior to and post-dropout.
When patients first begin using Glooko for diabetes management, Glooko downloads all historical glucose data stored on diabetes devices (this data was recorded by the patient prior to their Glooko use). This historical data is then compared to data recorded by the patients while using Glooko, which allows Glooko to analyze correlations between the patients’ use of the Glooko application and their changes in health outcomes (Figure 1, Timeline part 1). This pre-dropout analysis approach is common across digital health companies.
Glooko is also able to do a post-dropout analysis (Figure 1, Timeline part 2). After dropout, Glooko no longer collects patients’ diabetes data. However, most patients who stop using Glooko at home will typically continue to perform self-management and eventually visit their clinic for routine diabetes appointments. When clinicians upload those patients’ devices via Glooko’s in-clinic solution, Glooko obtains retrospective diabetes data for the time period between when the patients dropped out and their clinic appointments. This allows us to perform analyses on the second part of the timeline (shown on Figure 1: Current Analysis: What happens to diabetes outcomes after patients stop using Glooko remotely?).
Analysis & Results Summary
Across the 472 users analyzed we found that, on average, users who drop out (stop uploading data to Glooko and subsequently stop using Glooko) experience deteriorating diabetes outcomes. Compared to the two weeks prior to dropping out, at six to eight weeks post-dropout, we observed the following:
- An increase in average glucose by 5 mg/dL.
- An increase in percent of readings in hyperglycemia by 3%.
- A decrease in percent of readings in range by 1.7%.
- A 7.5% decrease in the number of daily glucose checks from an average of 4 to 3.7 readings.
The data suggests that patient dropout is correlated with future worsening diabetes outcomes. To prevent this, health systems implementing RPM programs can utilize Glooko’s ML-based Dropout Risk feature, which predicts, on a weekly basis, the risk that a patient will stop uploading their diabetes data to Glooko in the upcoming four weeks. Using this feature, health systems implementing RPM programs can identify which patients are at high risk of dropping out of the program and intervene ahead of time. This ensures continuity of care and smoother RPM program workflows while simultaneously preventing worsening outcomes.
Analysis & Results Deep Dive
In this analysis, we investigated self-monitoring glucose meter (SMBG) data from 472 Glooko users who met the following criteria:
- Used Glooko for at least six weeks by uploading their diabetes device data (SMBG and/or insulin pump devices) remotely; and
- Dropped out (stopped remotely uploading data to the Glooko platform after a minimum of six weeks of use while keeping their Glooko accounts for in-clinic appointments); and
- Had an in-clinic appointment after at least eight weeks post-dropout during which their data were uploaded to the Glooko platform.
We retrieved the patients’ glucose readings after dropping out to compare patients’ outcomes during the two weeks prior to and six to eight weeks post-dropout. Demographics are included in Table 1 (below).
|
Total N
|
Diabetes Type
|
Gender (for those who specified)
|
Age Median (IQR)
|
|
472
|
70% Type 1
11% Type 2
19% Other
|
53% Female
|
19 (13-47)
|
Table 1. Demographics of the cohort considered for analysis.
For each of the above metrics (average glucose, percent readings in hyperglycemia, percent readings in severe hypoglycemia, and daily reading count), we performed a paired student t-test comparing the two-week averages of the 472 patients during the two weeks prior to dropout to the two-week averages at six to eight weeks post-dropout. We deemed the hypothesis test significant (rejecting the null hypothesis that the two distributions are identical), if the resulting p-value was less than 0.05. I.e., we performed a statistical test to determine if there is a significant difference between the outcomes of this cohort prior to and post dropping out.

Average glucose increases after dropout
Average blood glucose (BG) values increased after dropping out. Patients experienced a steady increase in their average BG, reaching a plateau of approximately 193 mg/dL (value in mmol/L) at six to eight weeks post dropout, compared to 188 mg/dL (mmol/L) during the two weeks prior to dropout (Figure 2). This difference was statistically significant (p=0.004).
Figure 2. Average blood glucose (BG) in two-week increments across 472 patients prior to and post-dropout. The dropout week for all patients was aligned at 0 weeks (red dashed line), and week numbers are relative to the dropout week.
Percentage of readings in hyperglycemia and severe hyperglycemia increases after dropout, while the percentage of readings in-range decreases
The percentage of glucose readings that were in hyperglycemia (above 180 mg/dL) experienced a steady increase to reach an average of 47.5% at six to eight weeks post-dropout. Compared to the two weeks prior to dropout, this constitutes a 3% increase in hyperglycemia (Figure 3). This difference was statistically significant (p=0.02).
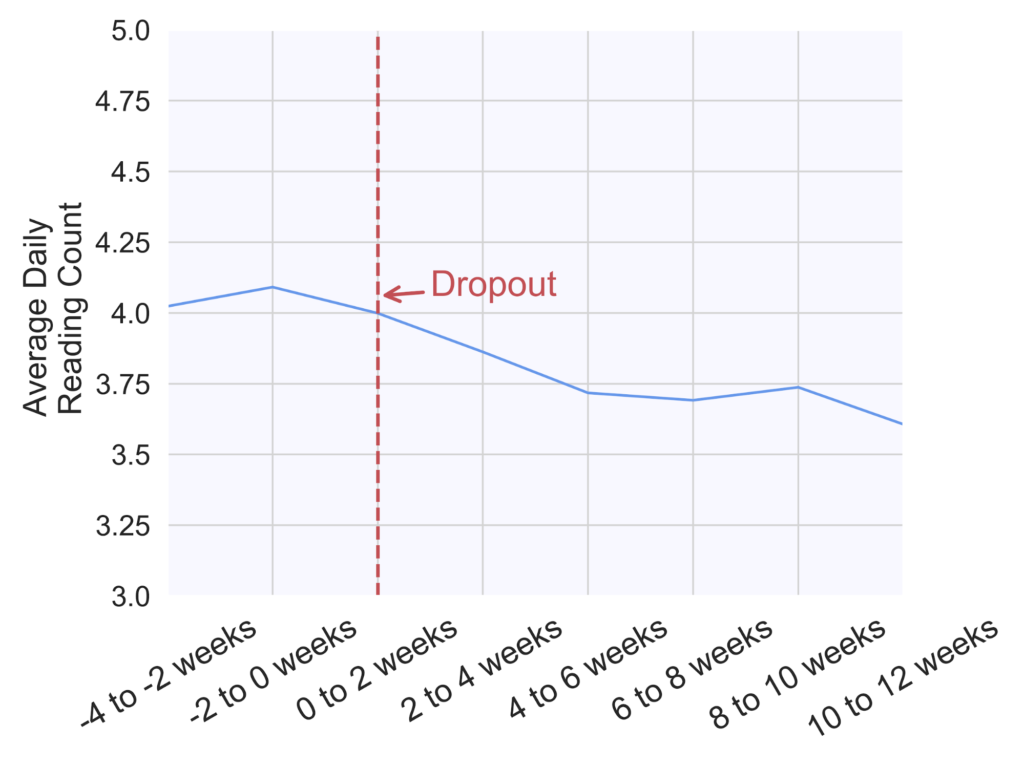
Figure 3. Percentage of readings in hyperglycemia (above 180 mg/dL) in two-week increments across 472 patients prior to and post-dropout. The dropout week for all patients was aligned at 0 weeks (red dashed line), and week numbers are relative to the dropout week.
Similarly, the percentage of readings in severe hyperglycemia (above 250 mg/dL) increased on average from 23.5% during the two weeks prior to dropout to 25% at six to eight weeks post-dropout (Figure 4). This difference was statistically significant (p=0.03).

Figure 4. Percentage of readings in severe hyperglycemia (above 250 mg/dL) in two-week increments across 472 patients prior to and post-dropout. The dropout week for all patients was aligned at 0 weeks (red dashed line), and week numbers are relative to the dropout week.
In parallel to an increase in hyperglycemia occurrence, we observed a decrease in the percentage of readings that were in the normal glucose range (70-180 mg/dL), as seen on Figure 5 (p=0.03).
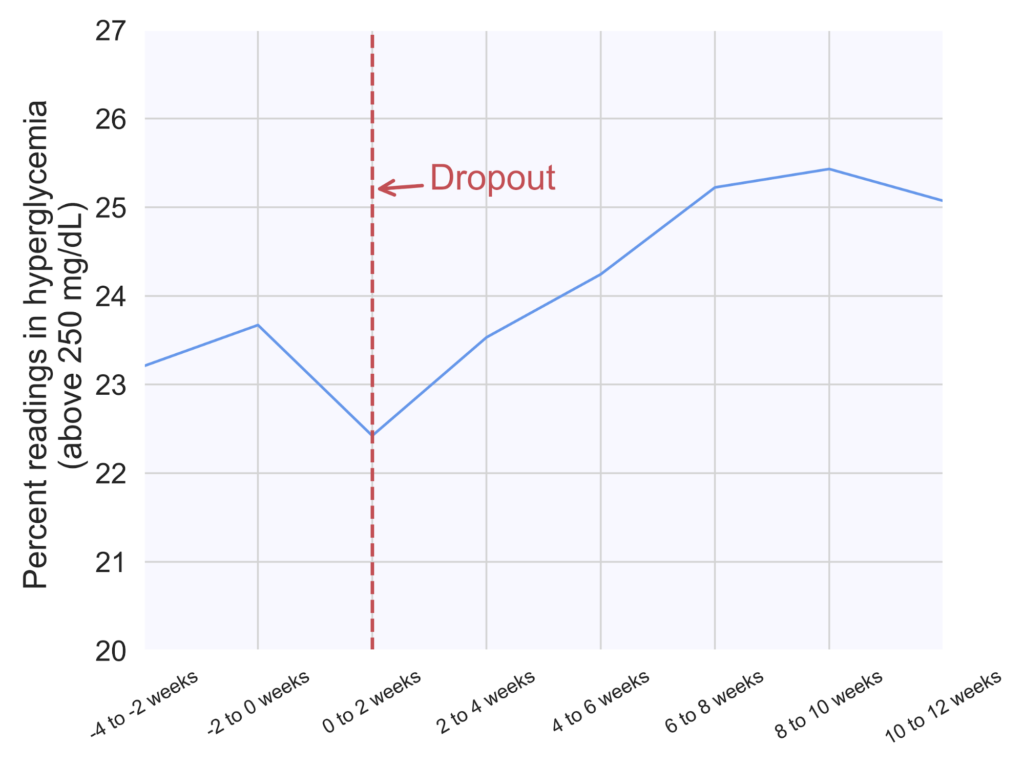
Figure 5. Percentage of readings in range (70-180 mg/dL) in two-week increments across 472 patients prior to and post-dropout. The dropout week for all patients was aligned at 0 weeks (red dashed line), and week numbers are relative to the dropout week.
The average number of daily glucose checks slightly decreases
Finally, the number of daily glucose checks experienced a 7.5% decrease from an average of four checks per day during the two weeks prior to dropout to 3.7 checks per day at six to eight weeks post-dropout (Figure 6). This difference was statistically significant (p<0.00001).
Figure 6. Average number of daily glucose checks in two-week increments across 472 patients prior to and post-dropout. The dropout week for all patients was aligned at 0 weeks (red dashed line), and week numbers are relative to the dropout week.
We did not find any discernible differences in the average percentage of readings in hypoglycemia.
MKT-0244 01
Glooko users show a slight trend toward better glucose control during the pandemic.
People with diabetes face a greater chance of experiencing serious complications caused by the coronavirus. To understand the impact of COVID-19 on people with diabetes, we analyzed glucose, insulin, and activity trends from users of Glooko solutions in the United States. We have measured data before and after mid-March, when the COVID-19 pandemic was declared as a national emergency and most state-level shelter-in-place orders came into effect.
Our main takeaways from the data analysis are that after shelter-in-place started, weekends and weekdays blend together when it comes to blood glucose levels. We also see a slight trend toward better glucose control and slightly lower and more consistent carb intake. There is however no change in insulin amounts.
To support people with diabetes and healthcare providers during the pandemic, we are offering a secure, privacy-protected remote-care solution at no charge to enable safe, connected patient care. This solution allows individuals to access ongoing medical care with their healthcare providers by facilitating remote appointments. People with diabetes are also able to track their glucose, insulin, and lifestyle data such as food and activity right in the Glooko Mobile app.
KEY TAKEAWAYS
Weekends and weekdays blend together
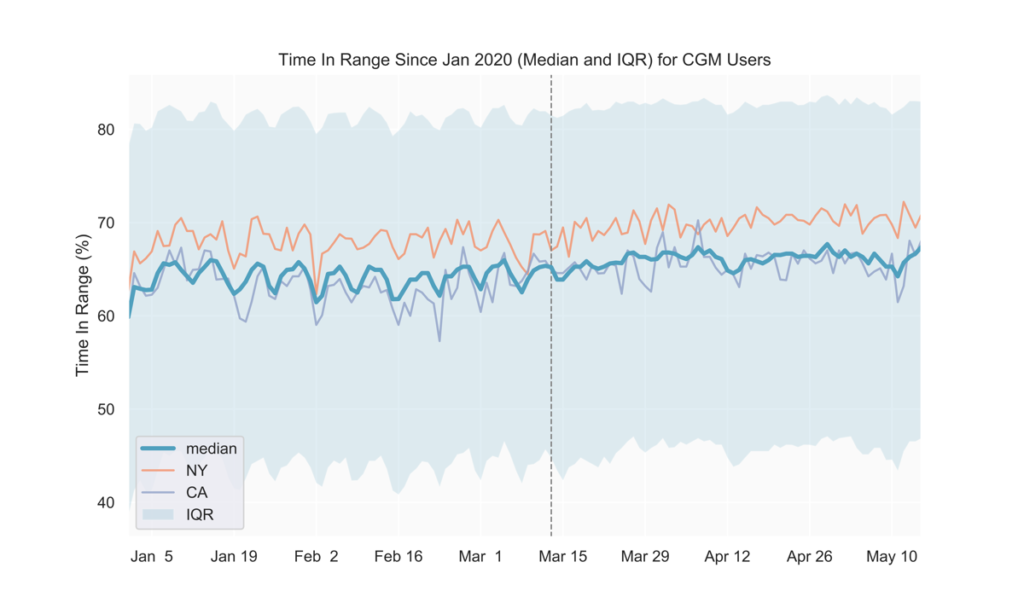
Prior to COVID-19-related shelter-in-place orders across the United States (around mid-March), we observed a weekly pattern consisting of relatively higher average blood glucose on the weekends, with the peak happening on Sundays. Similarly, time in range (TIR) for CGM users tended to be highest during the week and lowest on Sundays. Starting in early to mid-March, average glucose values decreased and the daily fluctuations over the week became less pronounced (Fig. 1, 2). Average glucose and TIR on weekends eventually resembled weekday levels pre-COVID-19 (Fig. 1, 2, 3).
The data show that since the national shelter-in-place order was implemented in the US in mid-March, the day-to-day fluctuations in glycemia that previously showed a weekly pattern began to dissolve, presumably as the day-to-day lifestyle and behavior on weekdays and weekends became increasingly similar.
Note: the slight peak in average glucose on April 12-13 corresponds to Easter Sunday and Monday.
Fig 1.
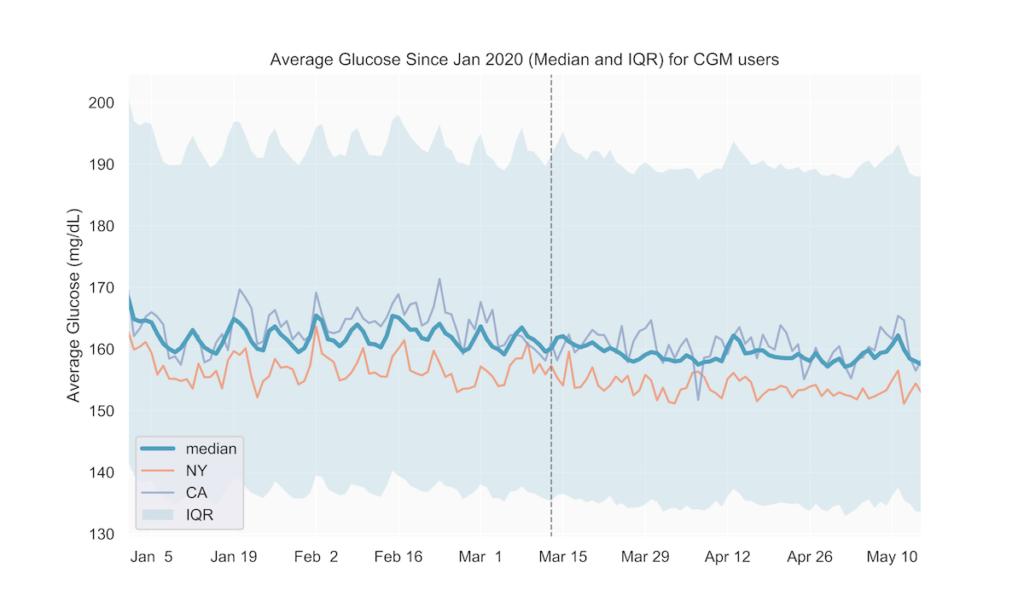
Fig 2.
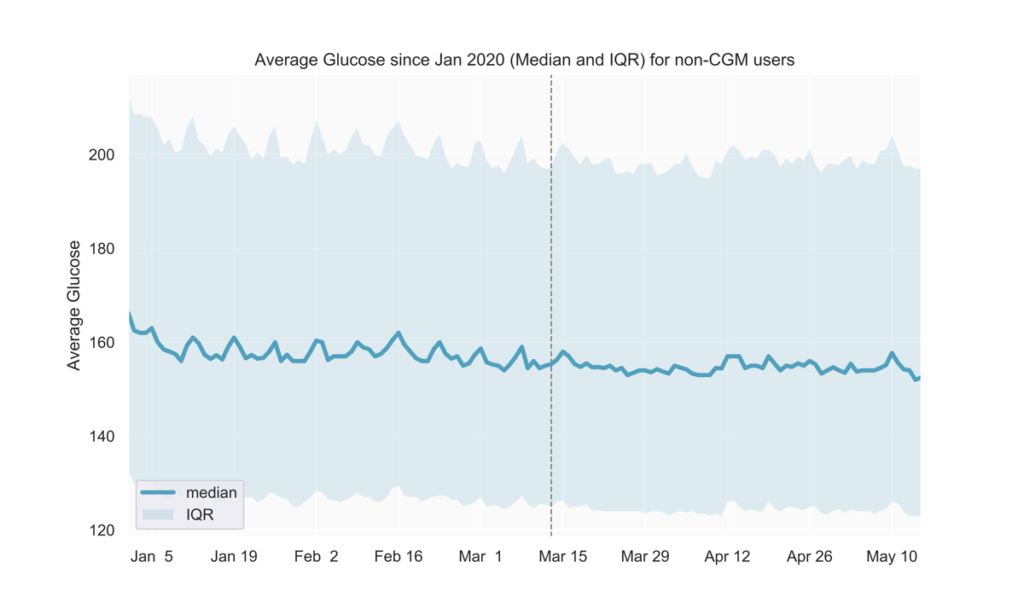
Fig 3.
Slight trend toward better glucose control
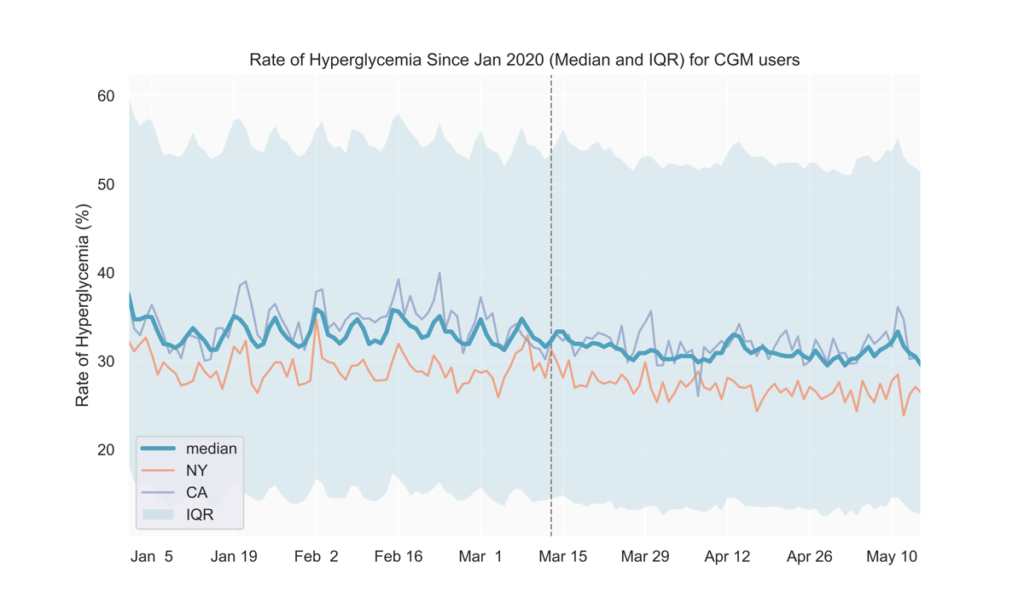
After mid-March, we observed lower average blood glucose levels and hyperglycemia rates, along with slightly higher TIR (Fig. 1-4). These could possibly result from staying at home leading to people with diabetes having more time for diabetes management.
Fig 4.
See the tables below for comparisons of glucose outcomes before and after March 13 (when the Federal emergency was announced). The differences in TIR, average glucose, and rate of hyperglycemia were statistically significant (p<0.0001).
| CGM users | Pre March 13 (3-week period) |
Post March 13 (3-week period) |
| TIR mean (IQR) | 62.3% (49.3, 76.5) | 63.3% (49.8, 78.2) |
| Average Glucose mean (IQR) | 166.4 mg/dL (142.8, 186.4) | 164.6 mg/dL (140.2, 185.3) |
| Rate of Hyperglycemia mean (IQR) | 35.3% (19.8, 49.3) | 34.3% (18.1, 48.6) |
| Non-CGM users | Pre March 13 (3-week period) | Post March 13 (3-week period) |
| Average Glucose mean (IQR) | 169.2 mg/dL (132.1, 195.4) | 167.5 mg/dL (129.5, 194.1) |
States with early adoption of shelter-in-place directives align with national trends
We also analyzed the above metrics at the state level to find out if shelter-in-place impacts on lifestyle and glycemic management in individual states affect our users’ glucose differently than the national average. As seen in Fig. 1 and 3, states adopting shelter-in-place relatively earlier (e.g., NY, CA) do not seem to show deviations from the national trends thus far. We will continue to track individual states as they gradually reopen to detect if any new trends emerge in the next few weeks.
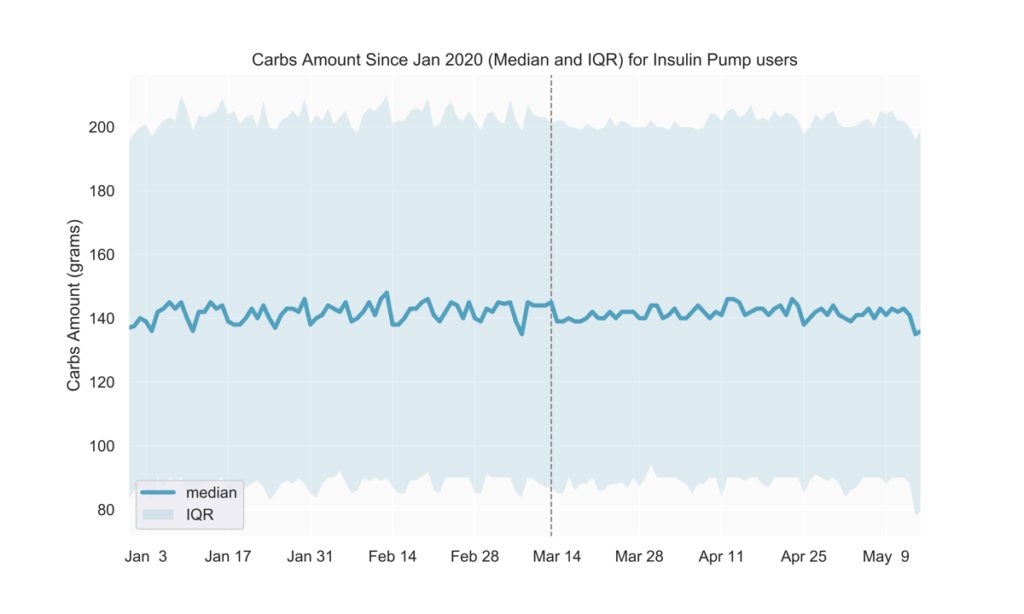
Slightly more consistent carb intake
Pre-COVID-19, carb intake was generally lower during the week and higher on weekends. Among people with diabetes who are insulin pump users, we observed less pronounced daily fluctuations over the week following mid-March (Fig. 5).
Fig 5.
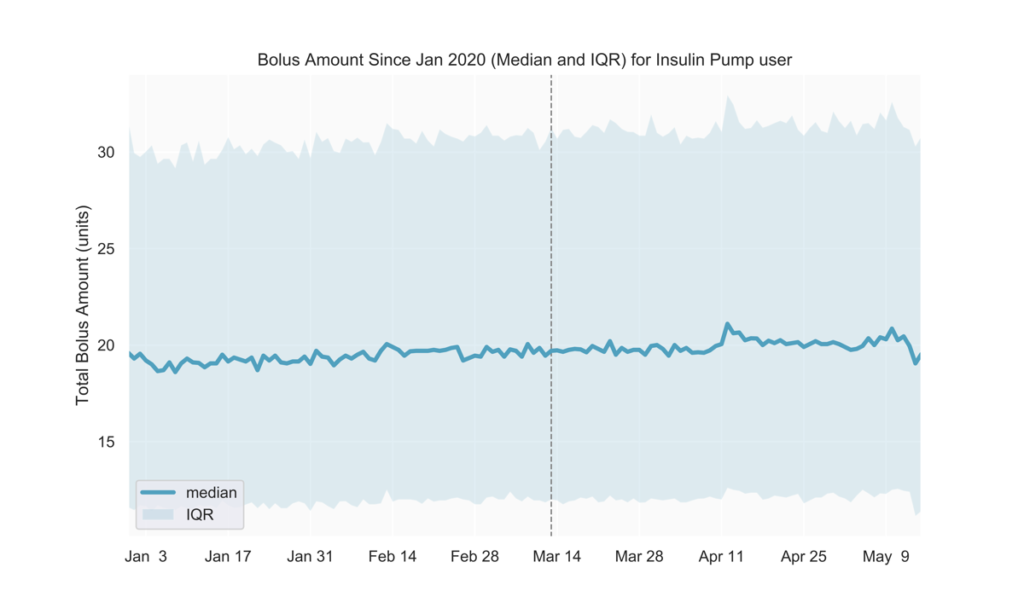
No change in insulin amounts
We observed no discernible changes in the total amount of daily bolus insulin dose among insulin pump users. We will continue to track insulin use to understand if possible disruptions in obtaining prescription drugs will reflect in users’ daily diabetes management. (Fig 6)
Fig 6.
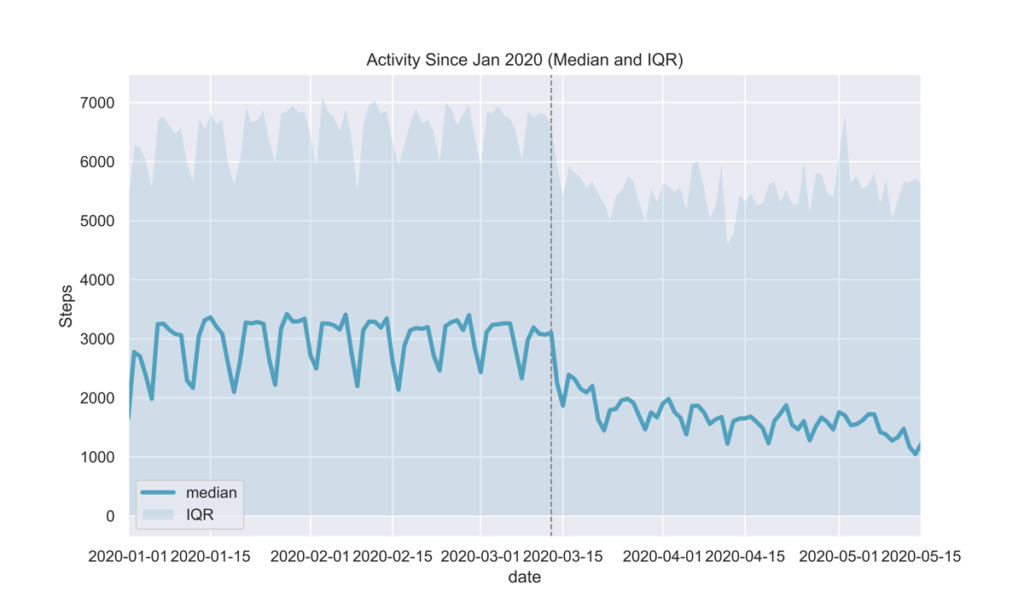
Decreased activity
Glooko users are able to easily track their activity and how it affects their glucose by connecting their preferred activity trackers and apps to the Glooko Mobile app. By analyzing daily steps, we observed a drop in activity post-March 13 as seen in Fig. 7. This was an expected outcome given national shelter-in-place orders in the USA.
Fig 7.
METHOD DATASET
Glucose, insulin, and activity data were sampled from in-clinic and at-home Glooko users in the USA between January and April 2020, and analyzed separately for two main cohorts:
- CGM users: People with diabetes who use a continuous glucose monitoring device,
- non-CGM users: People with diabetes who rely on glucose meters and/or insulin pumps for their diabetes management.
INCLUSION CRITERIA
This analysis included CGM users who had at least 144 CGM readings on any given day, and non-CGM users who had at least 1 glucose reading on any given day.
DEFINITIONS
- Average glucose
- non-CGM users: the average value of glucose readings on a given day in mg/dL
- CGM users: average estimated glucose value on a given day in mg/dL
- Time In Range (TIR), reported only for CGM users: the percentage of estimated glucose values between 70-180mg/dL on a given day
- Rate of Hyperglycemia reported only for CGM users: the number of readings above 180mg/dL on a given day
- Total Bolus Amount reported only for insulin pump users: the total units of insulin (normal and extended) on a given day
- Carbs Amount reported only for insulin pump users: the total amount of carbs that were entered into the insulin pump on a given day
MKT-0213 01